Trading and Idle Cash:
I'm a trader, and I keep buying and selling Mutual Funds, and Exchange Traded Funds.
- The buying consumes 'idle cash', for the purchase of MF/ETF.
- The selling replenishes 'idle cash', from the redemption of MF/ETF.
A trader, therefore, almost always has idle cash in her/his account. Depending upon market conditions the level of idle cash keeps fluctuating. When a trader is mostly 'out' of the market, the idle cash will be high, when a trader is mostly 'in' the market the idle cash will be low.
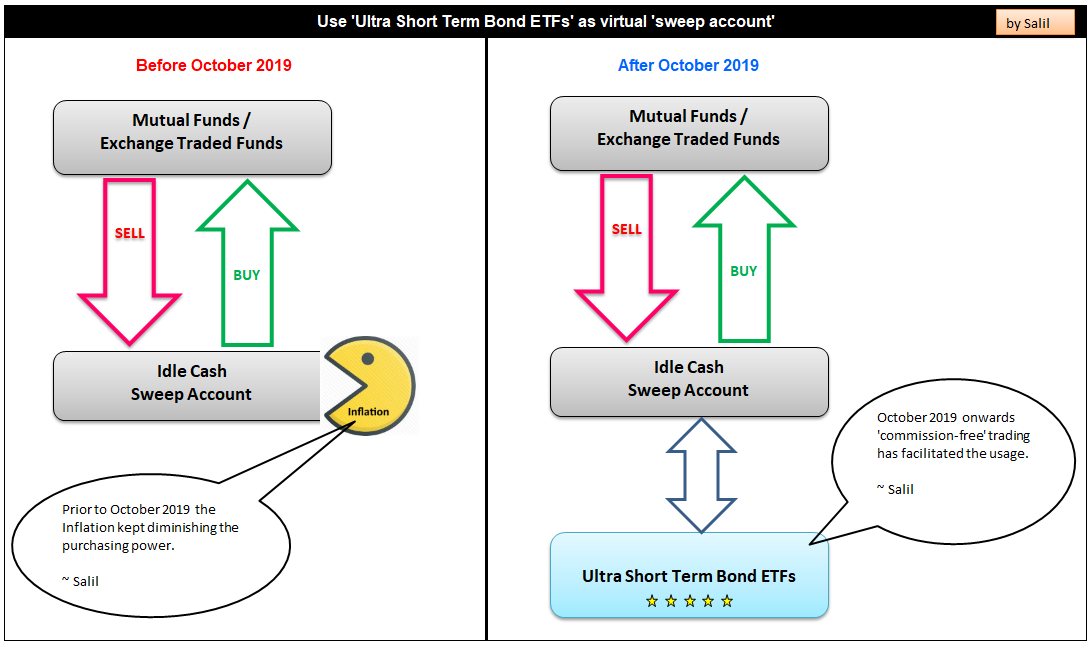
I trade on both bullish and bearish sides, so often times the idel cash I have is not very high. But no matter how hard I try to keep the idle cash low, almost always I have some amount of idle cash in my accounts. Until September 2019 the 'commission-free' trading for ETFs was not wide-spread. However the situation changed dramatically in October 2019.
In October 2019 the major brokerages started offering 'commission-free' trading for all the ETFs. Interactive Brokers, Charles Schwab, TD Ameritrade, E*Trade, and Fidelity started offering 'commission-free' trading .... as a result the situation for managing the idle cash changed dramatically!
Sweep Accounts:
For decades the brokers have been offering 'sweep' accounts. These accounts are quite transparent to most of the clients of the brokerages. Broker silently takes the cash out of the account every night, and places it into 'sweep' account. Whenever the cash is needed to stettle a trade, the broker silently takes the cash out of the sweep account, and settles the trade. (The trade settlement is almost always T+2 days. At times, it's T+1 or T+3 also. "T" stands for 'trade day' and 'plus' 1,2, or 3 indicates difference between the trade day and settlement day.) The operation of sweep account works very efficiently. (For 'margin' accounts the operation is different, however since I trade mostly in tax-deferred accounts - i.e. Traditional IRAs, Rollover IRAs, 401(k)s - the 'margin' does not come into picture, because 'tax-deferred' accounts are strictly 'cash' accounts. There is no such thing as 'margin' for a 'tax-deferred' account.)
These sweep accounts either are (a) Money Market Mutual Funds or (b) FDIC insured bank accounts. For the Money Market Mutual Funds the NAV (net-asset-value) is expected to stay at $1. In the history there are just a couple of instances when the value has gone below a buck for Money Market Mutual Funds. For the FDIC insured accounts there has never been any instance where anyone has lost even a penny from a FDIC insured sweep account used by a brokerage. (The probability of loss is there, however it is considered as nearly ZERO pobability.)
The shortcoming for such sweep accounts is that the interest/dividend offered is paltry. (I have seen the interest/dividend rates of 0.10% when the regular savings rates are at 1.25% or so. In this case the sweep account yield is appalling low.) My observation is that this is especially true when one is having idle cash in 401(k) accounts. It is also true when one is having an account at brokerage that does not offer any in-house Money Market Mutual Funds.
All of the above has an alternative since October 2019. The alternative is not as safe as the sweep account. However for a trader such as myself the higher interest/dividend offered by the alternative is much more attractive than the sweep accounts, and the risk is quite acceptable. The alternative is Ultra-Short-Term-Bond-ETFs that are offered by various brokers 'commission-free'.
Inflation:
There are many free sites that describe/define/explain Inflation. (Use your preferred web-search engine - Bing, DuckDuckGo, Google - and search the term 'Inflation'.) In short, the inflation diminishes the purchasing power of cash over time. The effect of inflation is non-stop - 24/7/365. I publish a widely used measure of Inflation - Consumer Price Index for Urban Consumers (CPI-U) at this link.
The shortcoming of the sweep accounts is that the interest/dividend offered is very tiny, and perhaps is not enough to overcome the rate of inflation. This means that amount of idle cash in the trader's account keeps losing the purchasing power all the time. Until October 2019 there was hardly anything I could do to help stop the loss of purchasing power of the idle cash. One way commission often times was $4.95. Which means each buy/sell in/out of Ultra-Short Term Bond ETFs would have cost me $9.90 making it prohibitively high for rapid trades I execute because of which the idle cash position flucuates rapidly. (Roughly I would have had to execute 30+ trades in various accounts per month only for Ultra-Short Term Bond ETFs to sustain my 'core' trading of leveraged ETFs, and Mutual Funds that goes into thousands of trades per year.)
I watched in dispair as the idle cash in my accounts lost the purchasing power month-after-month, year-after-year. But not any more.
Ultra-Short-Term Bond ETFs:
These types of ETFs are available for a very long time. The oldest I track is 'iShares 1-3 Year Treasury Bond ETF' which is available since 7/22/2002. The underlying securities for such ETFs are mostly the US Government T-Bills and T-Notes. The ETF has no insurance at all, and its NAV (price) flucuates. However, the underlying securities such as US Government T-Bills, and T-Notes are guaranteed to return the principal to the holder. (The guarantee by the US Treasury is by far much supirior than the mere insurance offered by FDIC.)
The advantage these ETFs offer over the sweep accounts is that the interest/dividend offered by these is often times higher than what's offered by the sweep-accounts. Often times the interest/dividend is enough to keep-up with the inflation. (At times it is possible even to beat the inflation.) This means that using these ETFs it's possible to maintain the purchasing power of the idle cash.
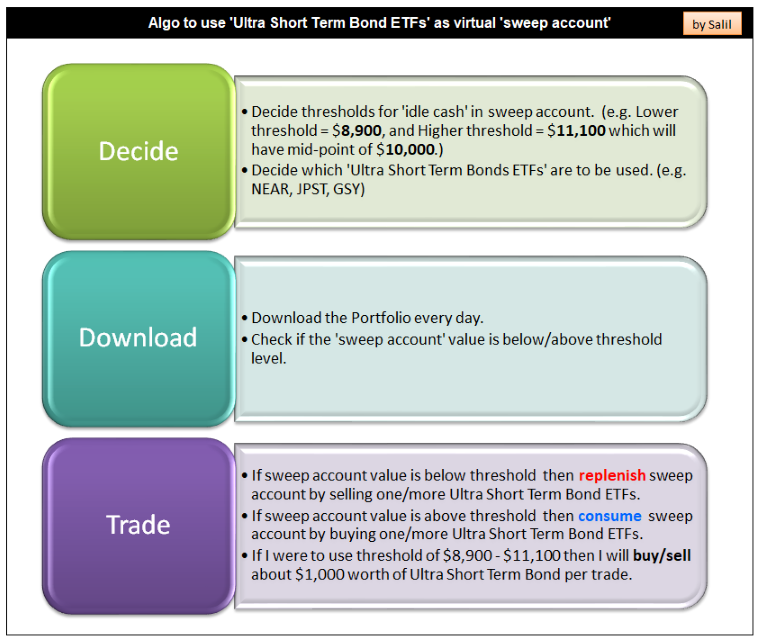
Solution - Use 'Ultra-Short-Term Bond ETFs' as virtual sweep account:
To decrease the negative effect of Inflation on idle cash is to try to minimize the size of the 'sweep account', and create a 'virtual sweep account' using Ultra-Short-Term Bond ETFs.
The algorithm to achieve the 'virtual sweep account' is given below.
Pictorial representation:
Few of the Ultra-Short-Term Bond ETFs I track/hold:

Chart Patterns:
The chart patterns for some of these ETFs reveals that the NAV (price) range is quite tight. This is of course not same as $1 NAV offered by Money Market Mutual Funds or FDIC insured bank accounts used in sweep accounts, however it's totally acceptable for my purpose of equivalent of somewhat stable price and chance to keep-up with (and perhaps beat) the inflation.
- For MINT the range is about 101.34 thru 101.76 from April thru October 2019.
- For GSY the range is about 50.19 thru 50.48 from April thru October 2019.
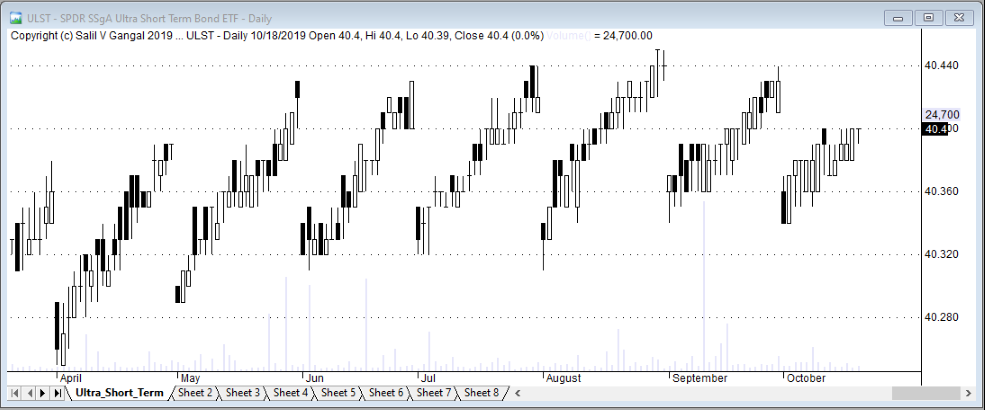
- For ULST the range is about 40.24 thru 40.44 from April thru October 2019.
The drop in NAV (price) at the end-of-month is because of the ex-dividend date alignment with the end-of-month. This is when the NAV (price) always drops by the amount of interest/dividend paid.
Chart pattern for MINT:
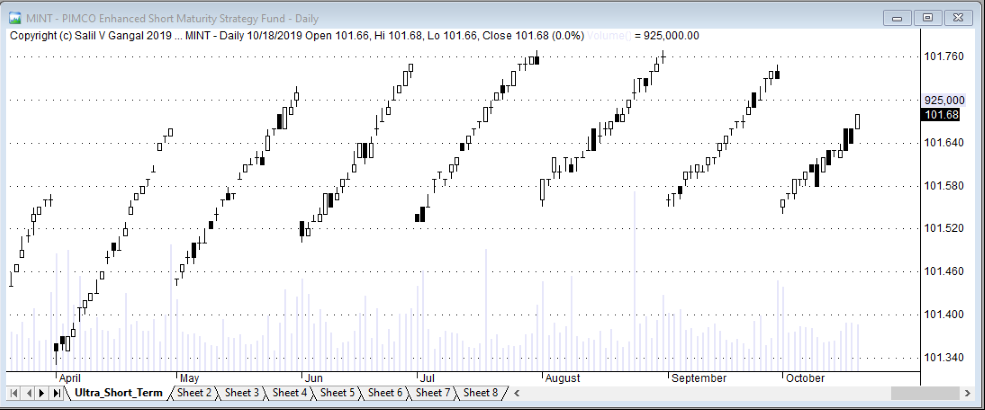
Chart pattern for GSY:
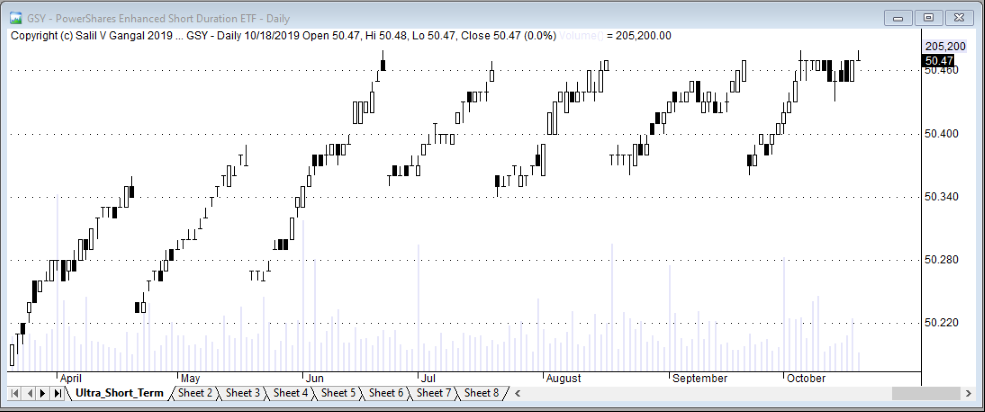
Chart pattern for ULST:
Trades:
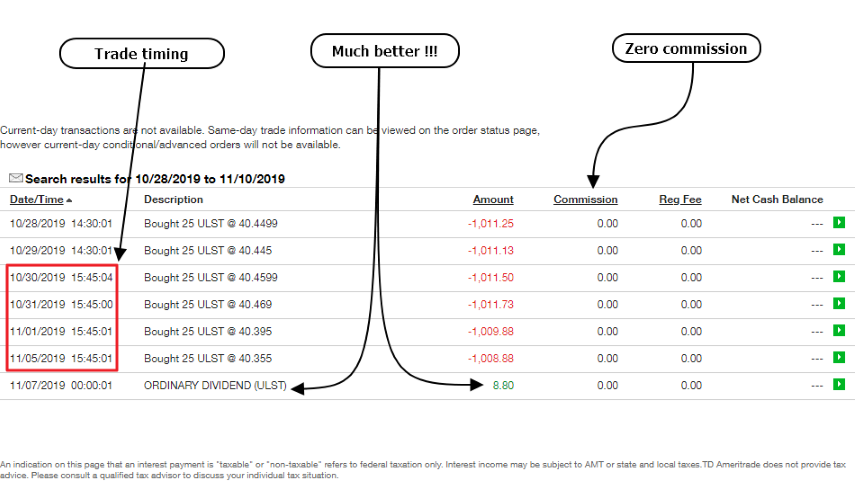
I am writing this update on 11/10/2019.
I implemented the Virtual Sweep Account, and I'm giving below the trades I executed, and returns I got since 10/28/2019. The screen-grab shows the transaction history for my TD Ameritrade account for ULST (SPDR SSGA Ultra Short Term Bond) with start/end dates 10/28/2019 to 11/10/2019. The flcutuation is as expected, and it matches closely with what's depicted by chart-pattern above.
The dividend of $8.80 is 'much better', especially compared to nearly zero that I'd otherwise get for idle cash. The 'commission free' trading makes this sort of virual sweep possible. Had there been commossion of say $4.95 per trade, then I would've paid $29.70 for these 6 trades (6 x 4.95 = $29.70) which would have negated the dividend totally.
The return of 2.00% to 2.75% per year, may see rather low. However this return is not for just a month or two - it's going to be there for quarters/years/decades. And it's for the 'idle cash' that's just waiting to get used up for trades !!
Trades timing:
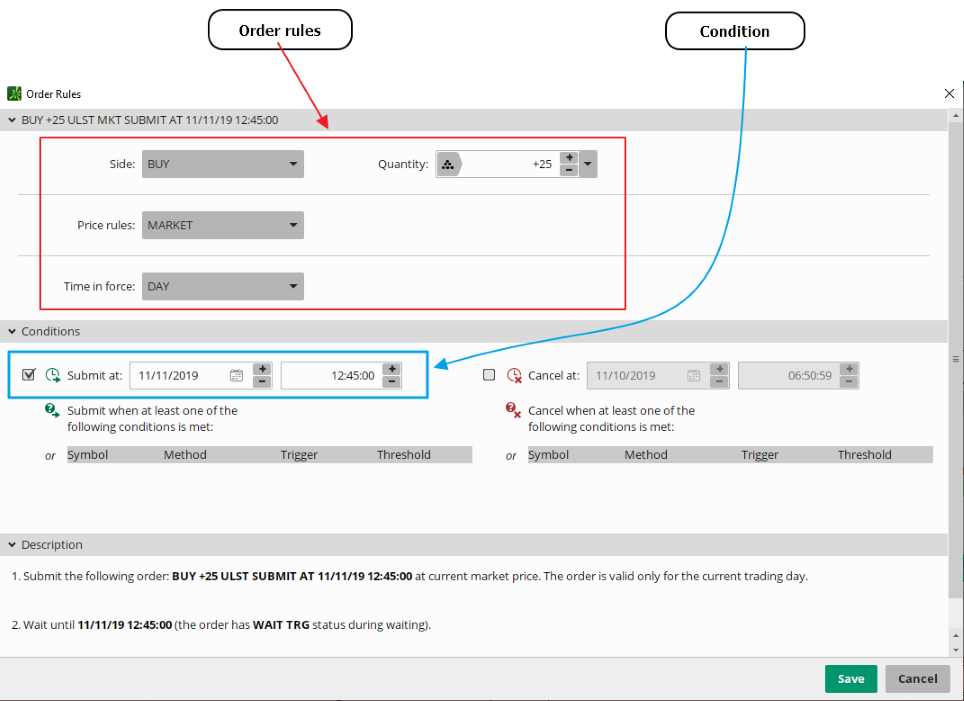
Generally I place Limit Orders for all the ETFs I trade. However, I've made an exception for the Ultra-Short-Term Bond ETFs. I place Market Orders instead of my regular limit orders. This is because the Ultra-Short-Term Bond ETFs I trade are very liquid, the volume is quite high, and the spread between bid/ask is quite low. (I've seen the spreads that are half or quarter of a penny (I repeat half or quarter of a penny) from time to time !! See the history above where the purchase price is $40.4499 and $40.4599 which is going into the precision of one-hundreadth of a penny !! For an individual trader, such as myself, whose typical trades are small - about $1,000 to $10,000 per trade - this sort of precision for price is unimportant. but for institutional traders who routinely trade $100,000 and up per trade - many times in a day - this ought to be quite important.)
I make these orders go to market at specific times.
In the trade history above the 'trade timing' is within seconds after 15:45:00 Eastern - that's 12:45:00 Pacific - which is 15 minutes before the regular market session closes, and extended session begins.
Image below shows the order-entry screen where I use custom 'Buy' order. This is @ TD Ameritrade.
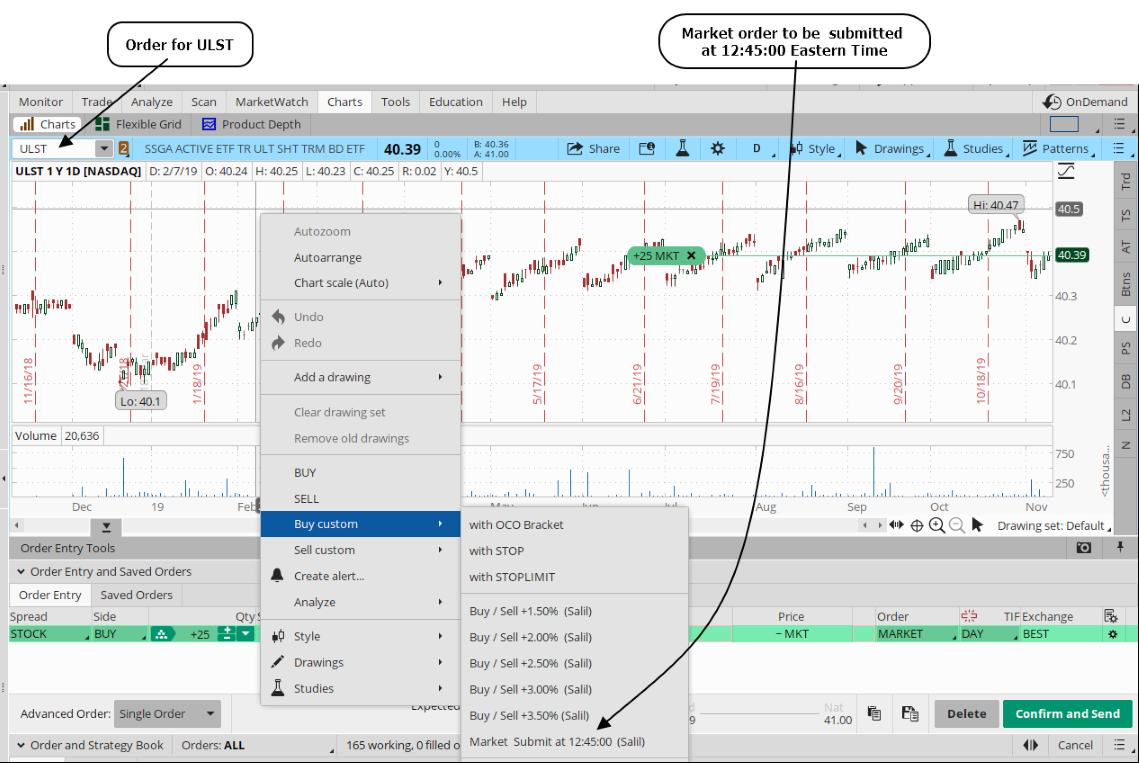
Image below shows the order I will send to market tomorrow at 12:45:00 Pacific (that's15:45:00 Pacific).
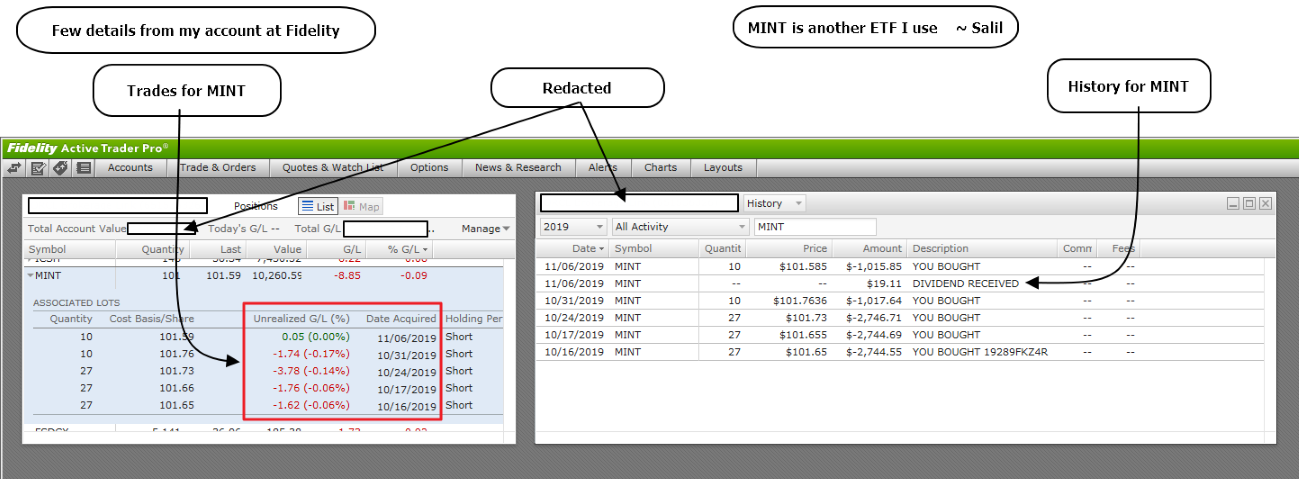
MINT Trades:
Image below shows details of my transaction-history/trades for MINT from my account @ Fidelity. Similar observations as above. Tight trading range - low risk - reasonable returns.
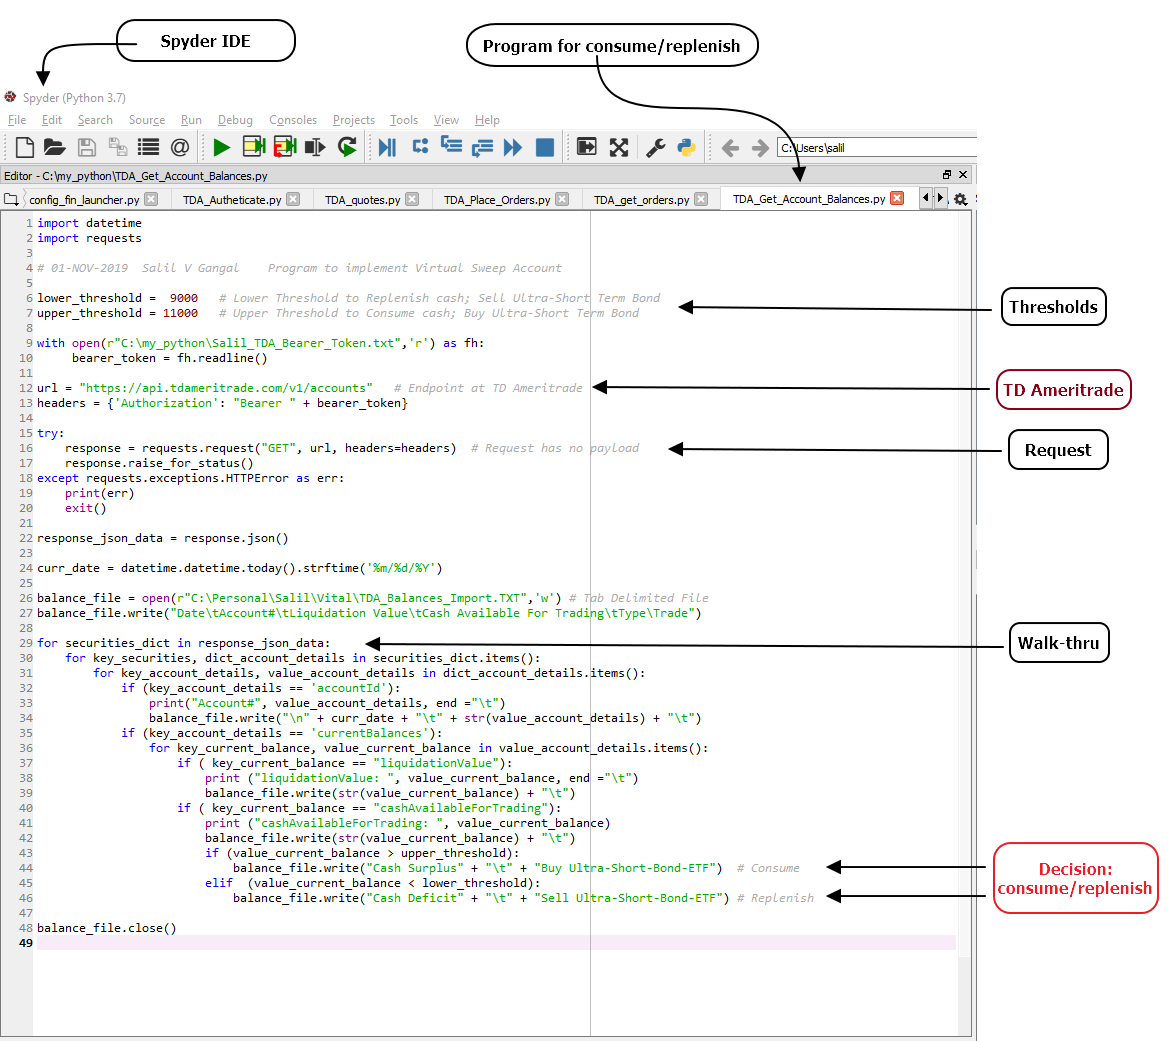
Python program to Automate the 'consume/replenish':
The following image gives details of Python program that automates the consume/replenish. This program uses the REST API provided by TD Ameritrade.
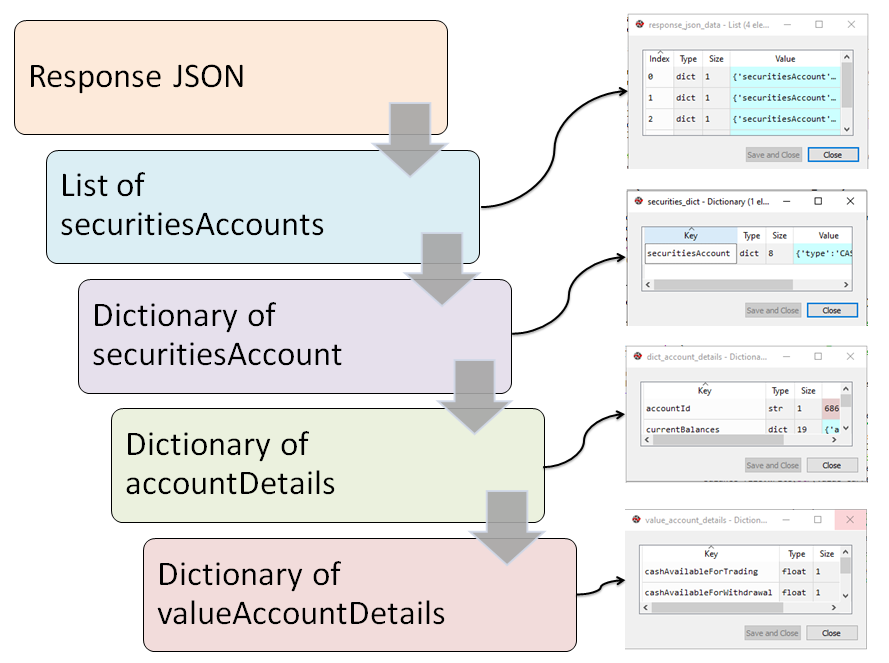
Representation of the JSON response sent back by REST API using Python:
Image below gives details of JSON response send back by the TD Ameritrade's "accounts" REST API call.
The response JSON structure in Python from top to bottom is: (a) List (b) Dictionary (c) Dictionary (d) Dictionary
The left side of the image shows the variable type+name, and the right side shows the corresponding Python variables using Spyder IDE.
|