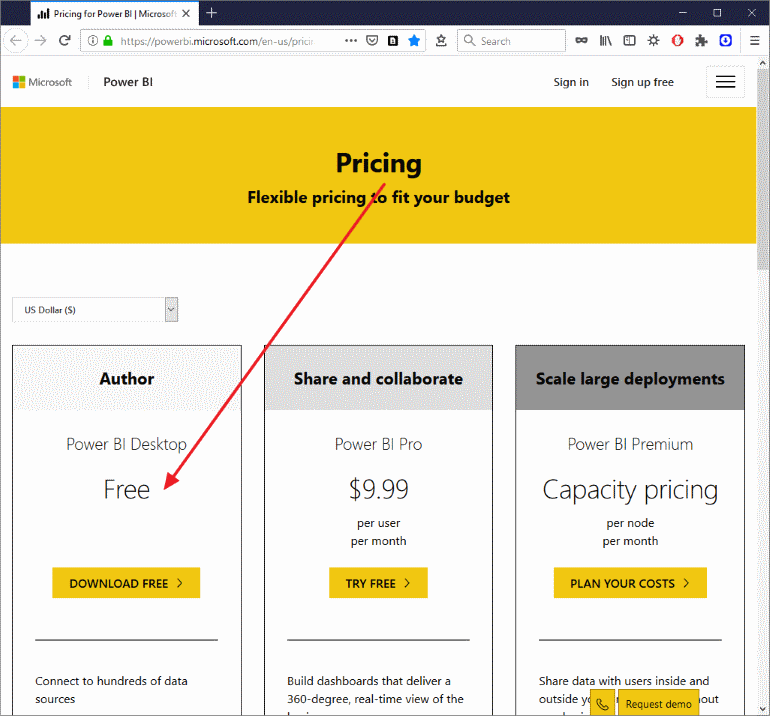
Microsoft offers 'Power BI Desktop' software, free-of-charge, for individual use (see image of pricing page at the bottom).
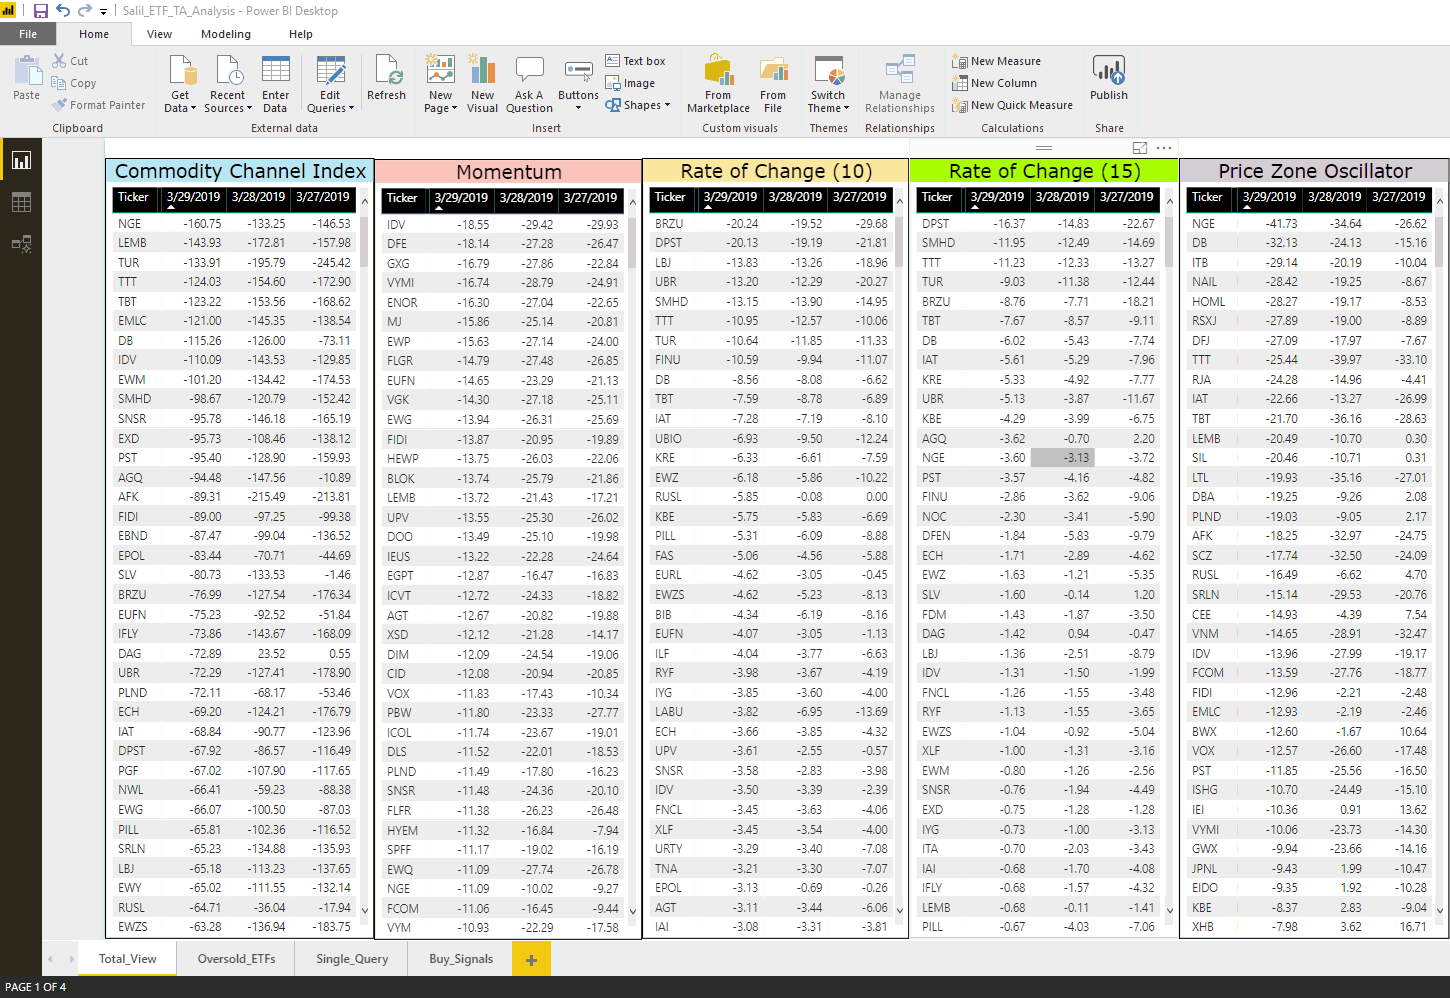
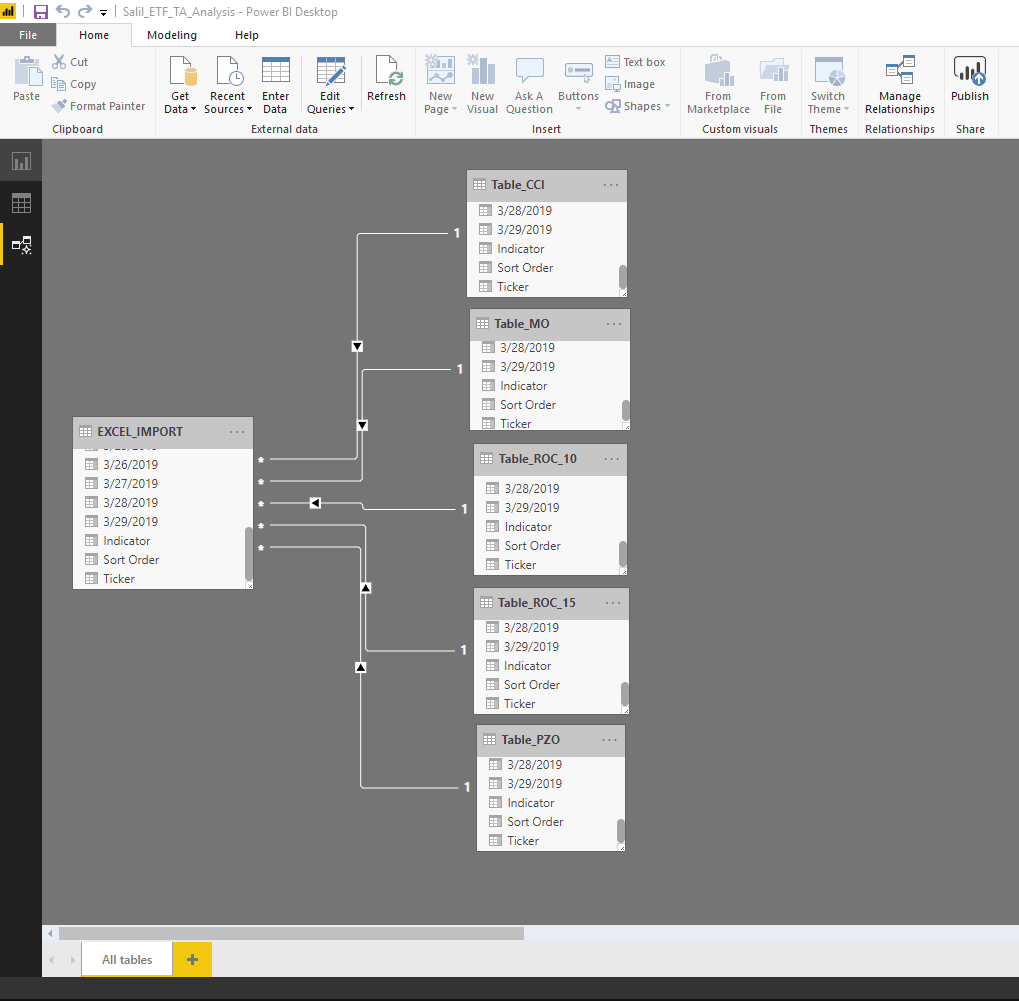
I use Power BI to get different views, perform queries, get oversold securities, and to generate buy signals. Whereas the charts available in Power BI are useful, these are not ideally suited for 'chartist' such as myself. I use Amibroker and TC2000 to perform charting.
Actually after the base/raw data is fetched into Power BI, the stories, the visualizations, the intelligence that may be generated are limitless ( ... or may be limited only by one's imagination/usage/time *smile* )
|


