  |
Muni - 2/19/2021 |  |
2/19/2021:
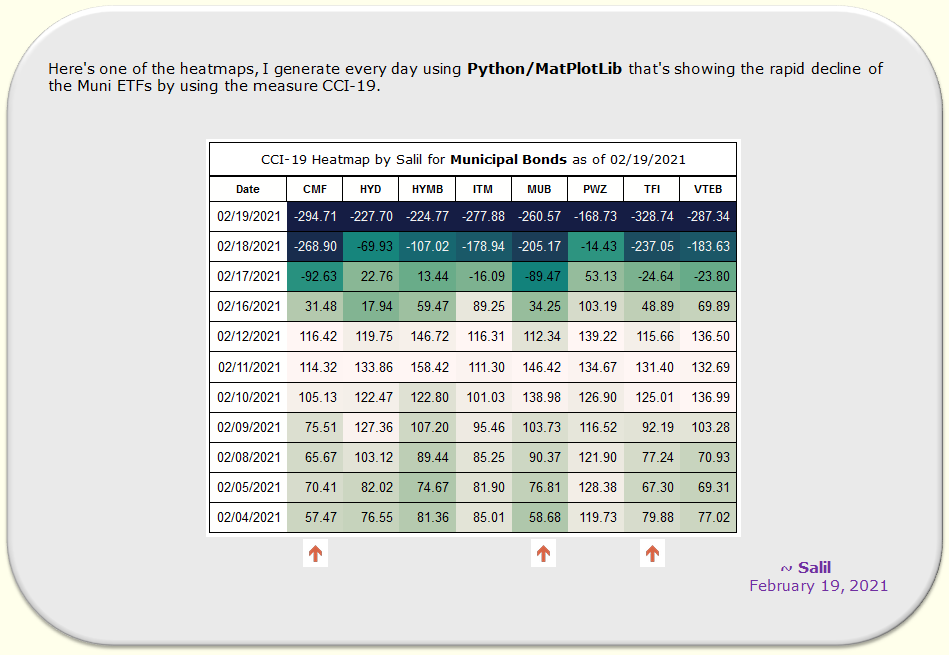
Heatmap CCI-19:
Tax Equivalent Yield:
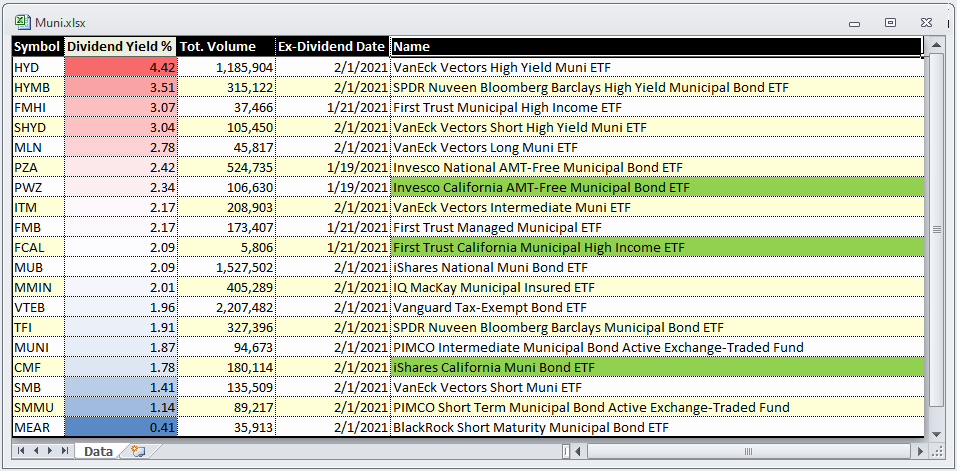
For the folks who are in higher tax bracket, it's useful to understand what would be the effect of using the Muni Bonds, since the resulting dividends are tax-free. I live in California, therefore, for the ETFs like CMF and PWZ dividends are tax-free for me both from the Federal, as well as State Income Taxes.
I've created an on-line calculator to make a conversion of the Tax-Free Yield into equivalent Taxable Yields using JavaScript. ( Yes, at times I code in JavaScript as well ! )
Click here to surf over the calculator.
Heatmap / Python:
I use a range of visualizations for gathering the intelligence I need for trading.
I've given the 'Lne Charts' below that are quite commonplace. However the 'heatmaps' are not all that commonplace, and the style I use where I combine different (or similar) classes of ETFs to make a color enhanced VIZ, allows me to quickly get the intelligence I need. This is fully human intelligence - there's no 'atrificial intelligence' involved here !!
I've done the coding using Python/Pandas/MatPlotLib. ( Python is my mother tongue !! *smile* )
Click here to surf over to the page where I've given details for the 'heatmaps'.
CCI-19:
CCI stands for "Commodity Channel Index". It was developed in 1980 by Mr Donald Lambert. He wrote about CCI in his book. The book is available from magazine - TASC (Technical Analysis of Stocks & Commodities) at store dot traders dot com.
CCI is an unbounded Oscillator. In theory, the oscillations have no upper/lower limits. Lower values of oscillations tend to indicate different degrees of 'OverSold' conditions, and higher values of oscillations tend to indicate different degrees of 'OverBought' conditions. Of course there is no sure way to make a judgement if/when a trader should act/not-act upon CCI oscillator. The action (or inaction) by a trader is a matter of her/his skill/experience/tactic etc. which goes beyond 'science/mathematics/charting', and falls in the realm of 'art' - which is the 'art of making money'. *smile*
Values of CCI-19 are perhaps closer to the starting point of the 'algo' of overall trading, and the culmination is a placement of a trade, and expected outcome is ... well ... profit ... Oh ... and if the expected outcome does not happen, then the measure of success is how effectively does the trader limit her/his losses.
By mathematical definition, an Oscillator ought to oscillate, therefore I tend to use the oscillators like CCI to judge the 'reversion-to-mean'.
I prefer using unbounded oscillators such as CCI, PZO (Price-zone-oscillator), various ROCs (Rate-of-changes over difference periods) rather than the bounded oscillators such as RSI (Relative-strength-index), Stochastic. Only exception is I like to use Chande Momentum Oscillator (CMO) which is bounded. Click here and see the second image where Columns E-F-G, and K-L-M show usage of CCI and PZO respecively using Excel Workbook I generate every day. The image is of course an old image, but demonstrates another sort VIZ.
Click here to see a related article on TASC, and click here to see the WikiPedia where the formula is explained.
I've implemented the CCI formula using Python/numpy, and done the Heatmaps using Python/MatPlotLib/Pandas.
All of the text/material/books I've studied focuses on the value 20 for the Periods in CCI. However, I use value 19, hence I call this by name CCI-19.
Dr. Tushar Chande developed CMO - Chande Momentum Oscillator. He has desribed it in his book "The New Technical Trader" published in 1994.< < It's interesting that Tushar has named other Technical Indicators he's developed after his relatives - Vidhya, Ravi, and Aroon. All are Saskrit words meaning Education, Sun, and First Light at Dawn. (I have developed two Technical Indicators, and I used Sanskrit words to name them - Disha and DigBheda, which mean direction and divergence respectively.) > >
Dividend Yield % for some of the Muni ETFs:
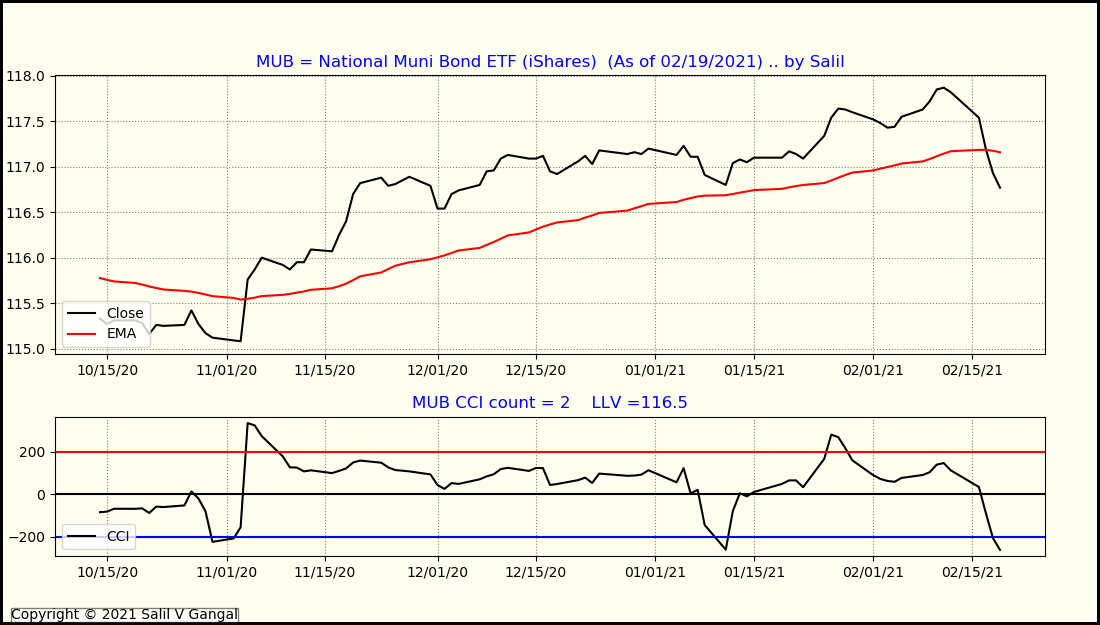
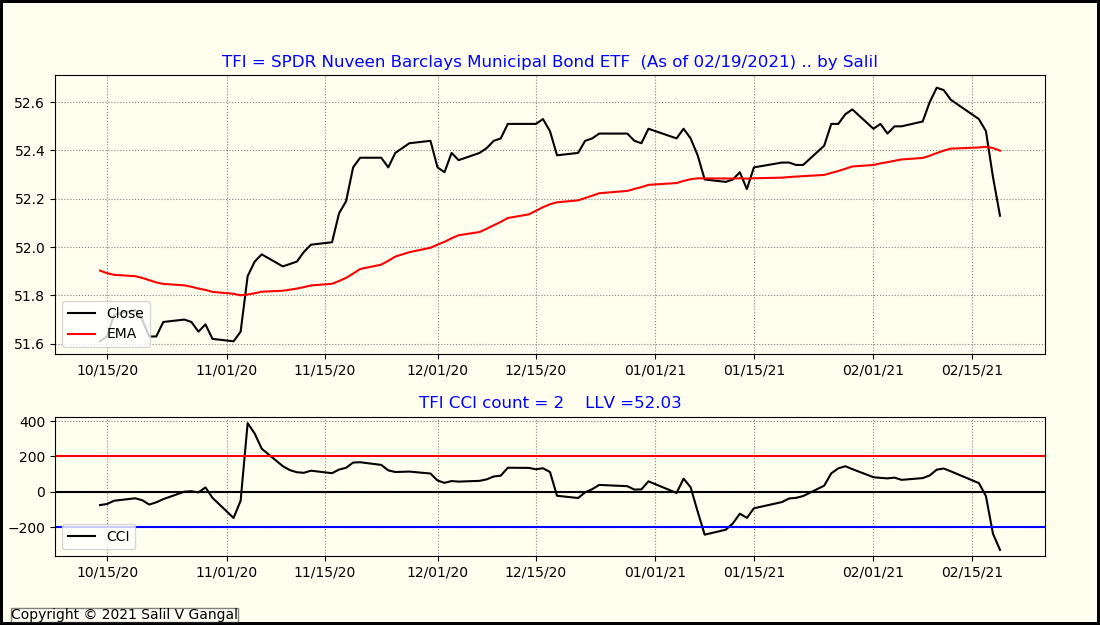
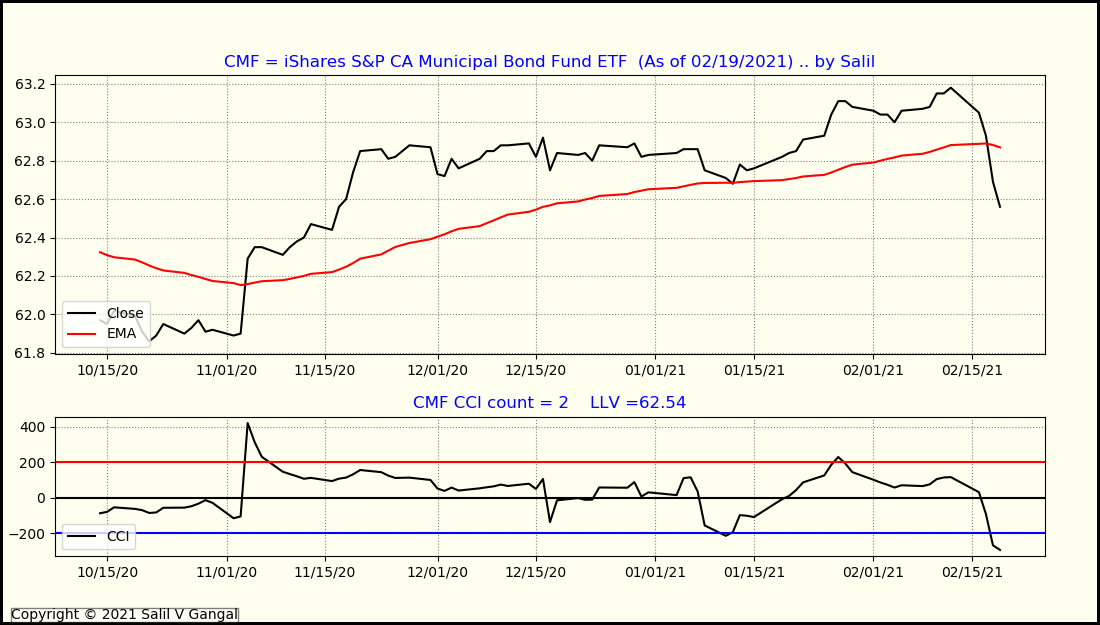
Charts for MUB, TFI, and CMF:
Epilogue 2/27/2021:
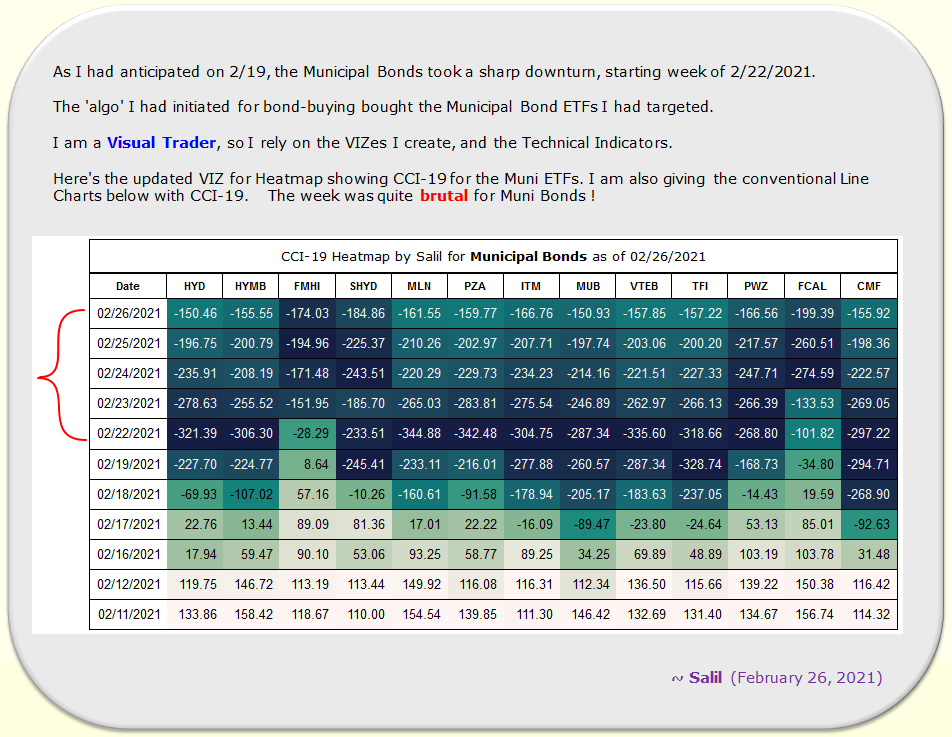
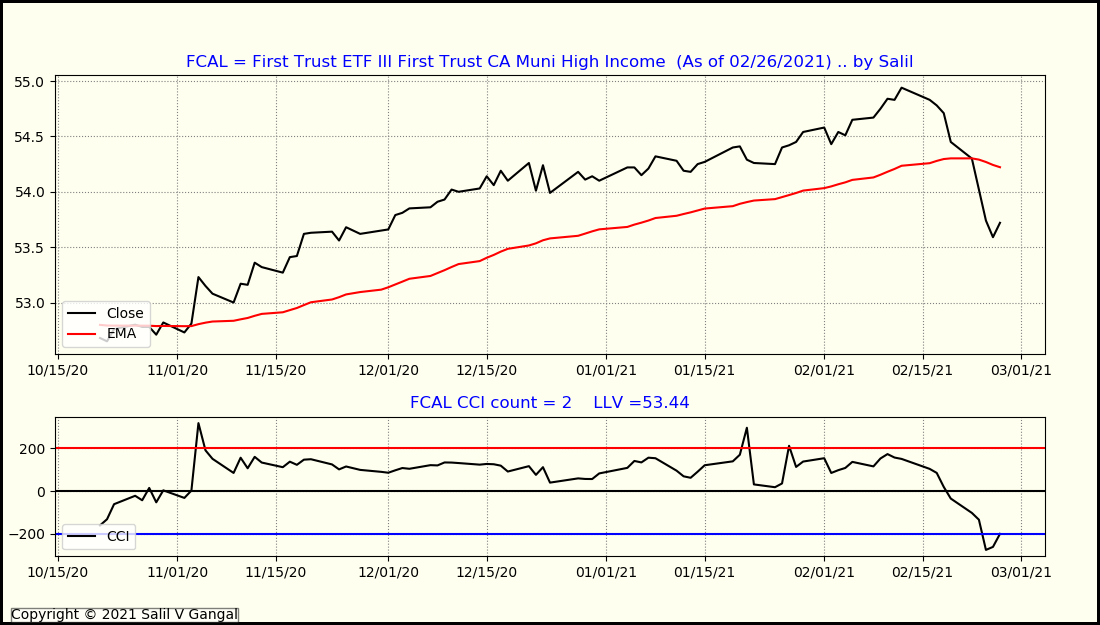
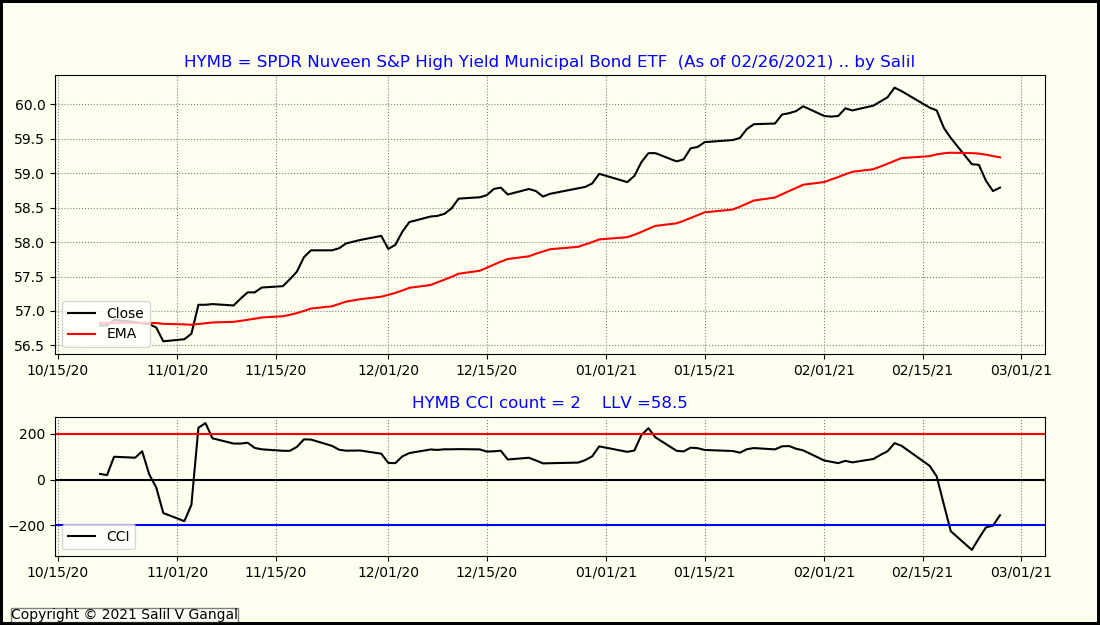
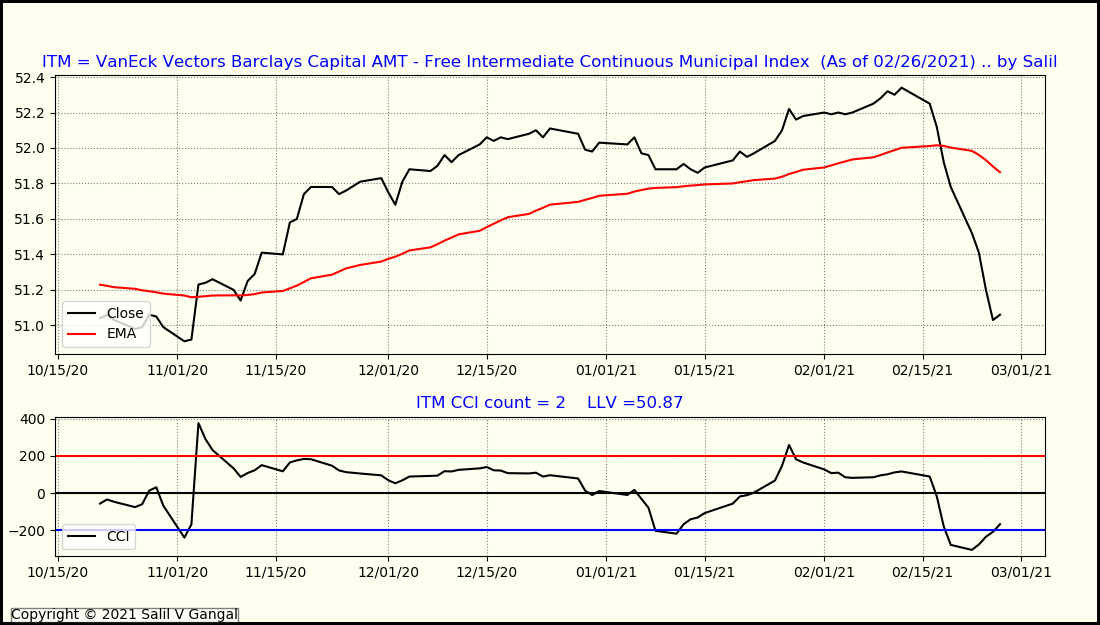
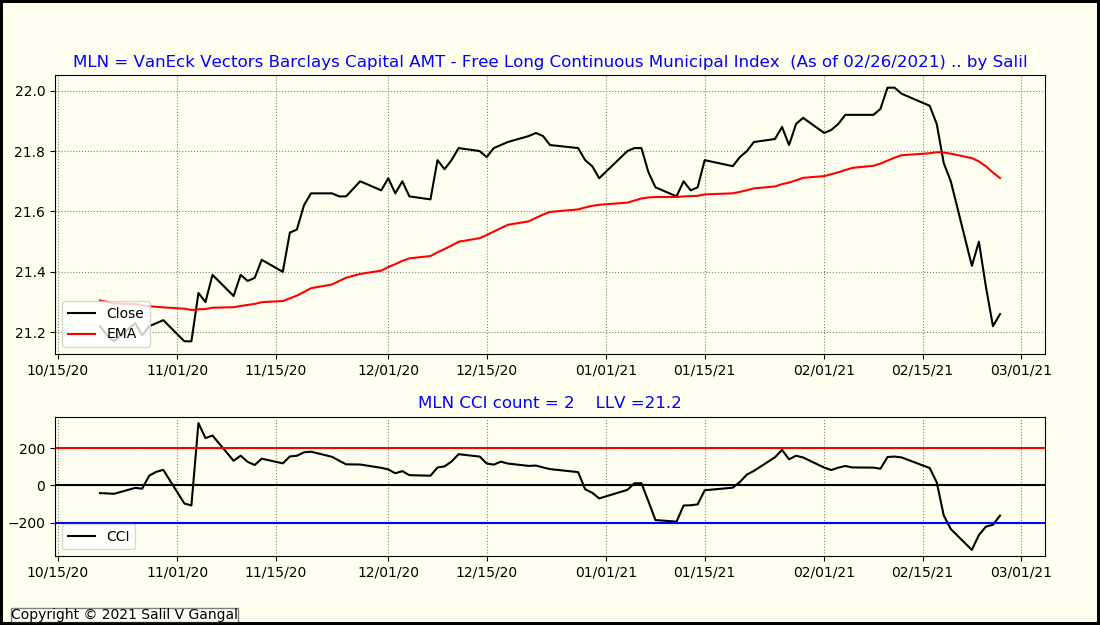
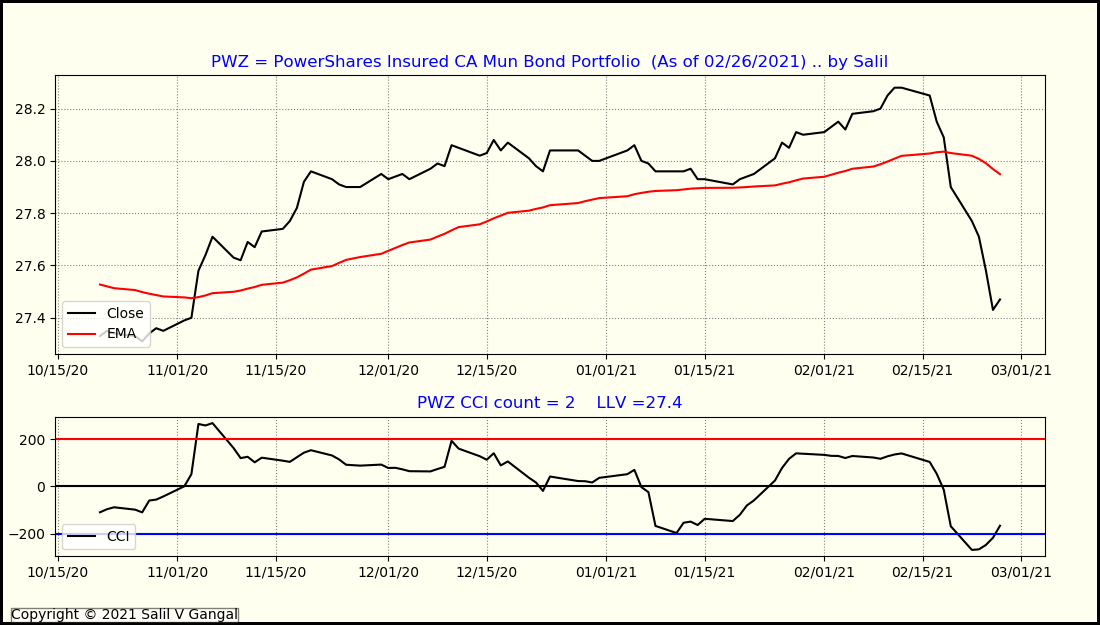
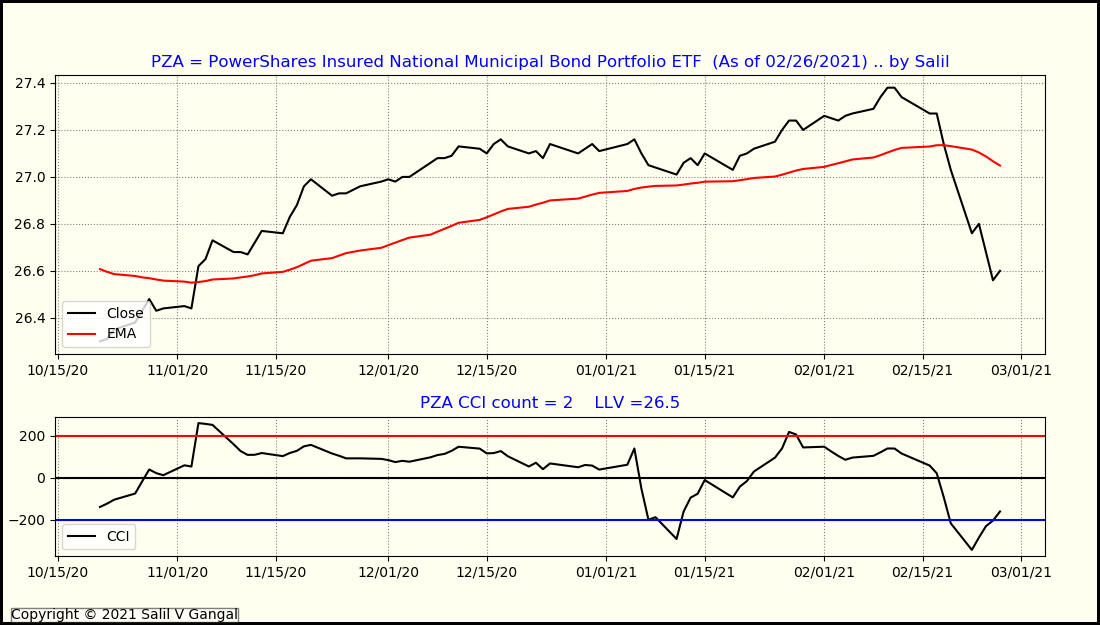
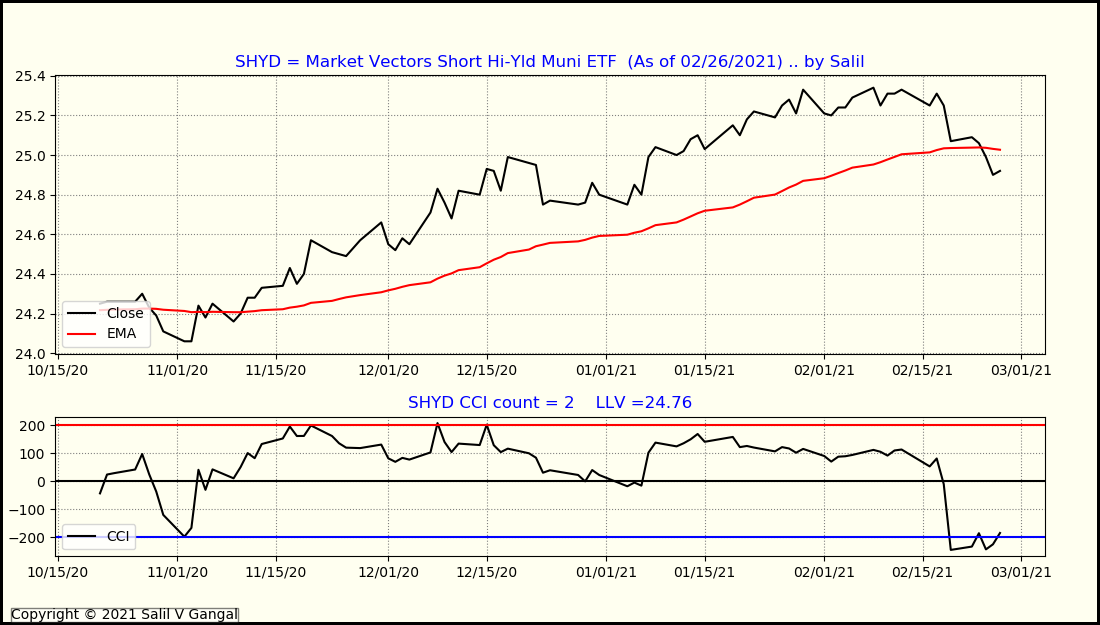
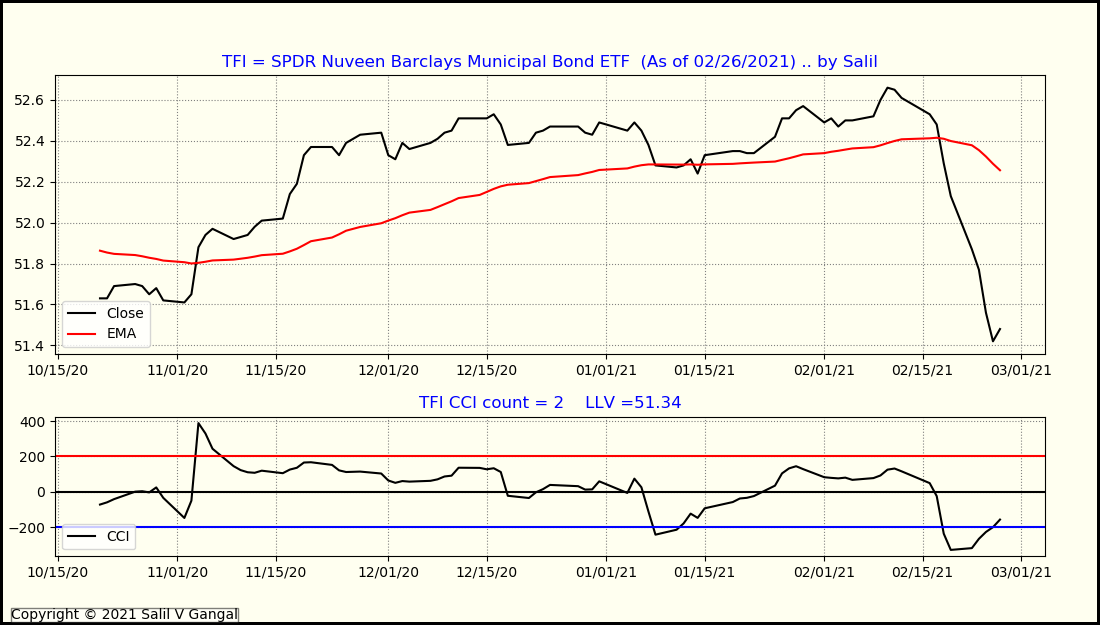
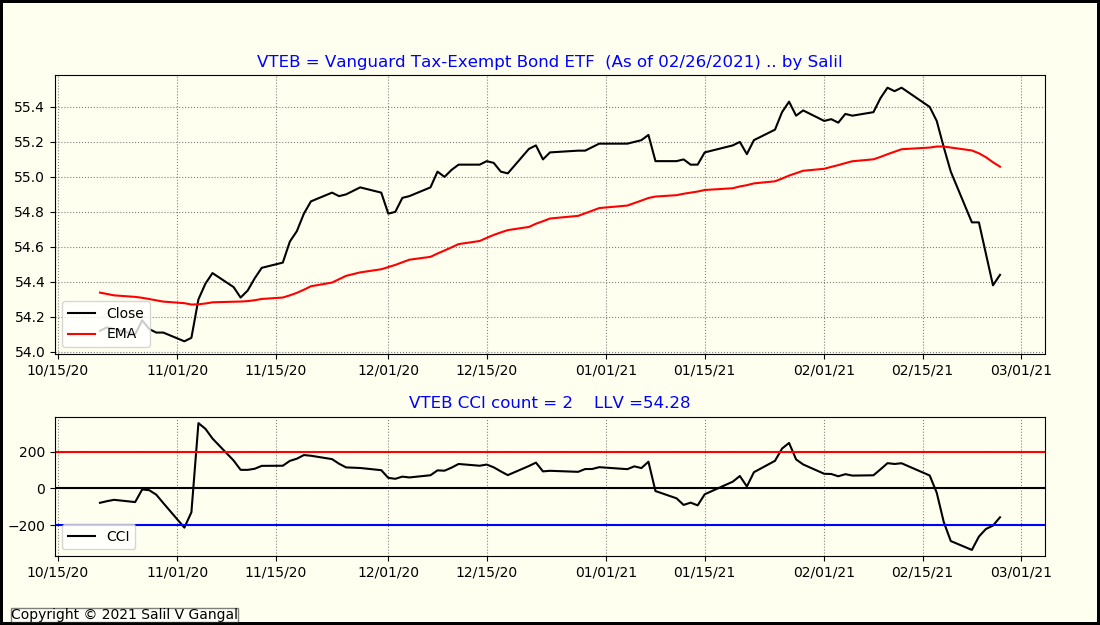
Charts for Muni Bond ETFs showing sharp downturn:
