As a trader, I like to get a one page summary of how have the Financial Markets performed over the past year.
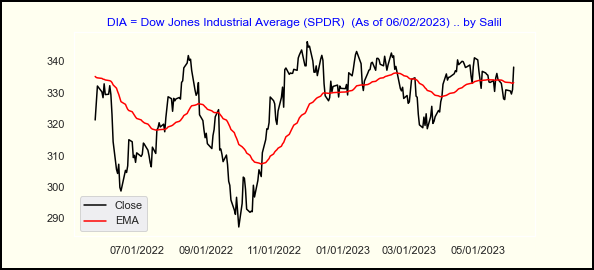
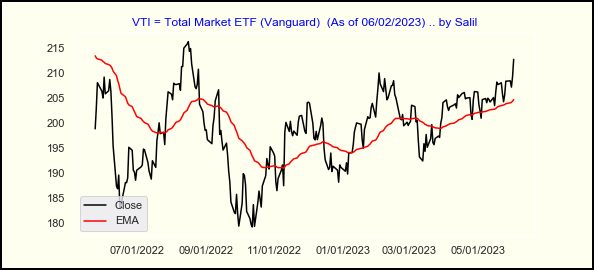
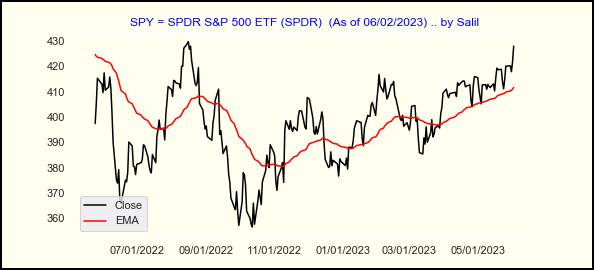
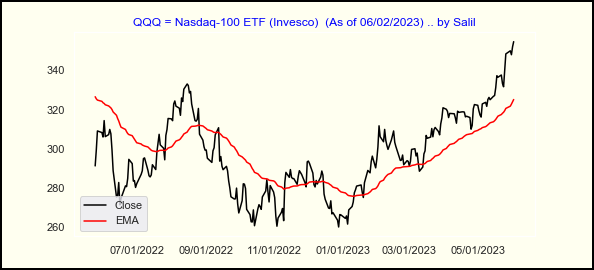
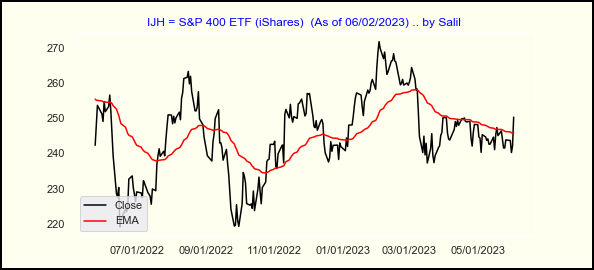
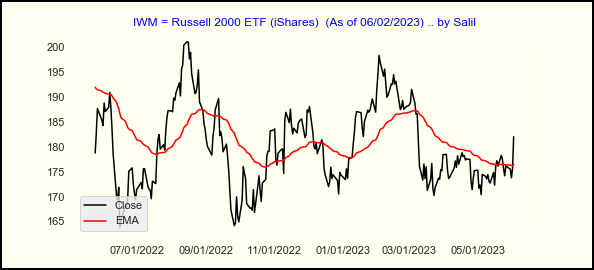
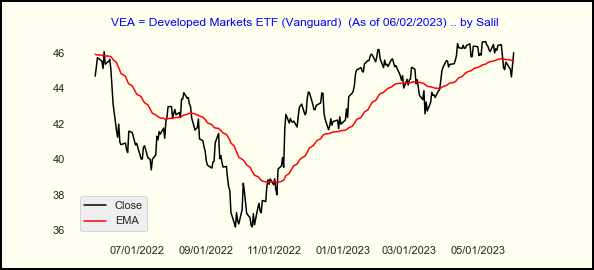
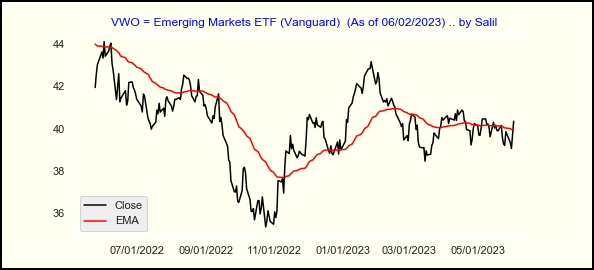
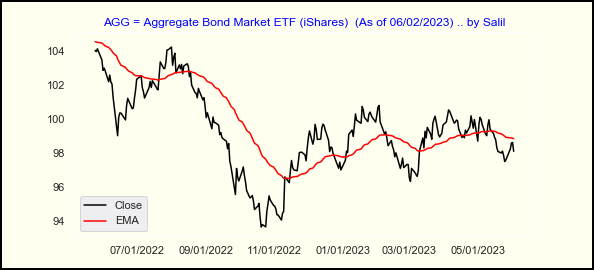
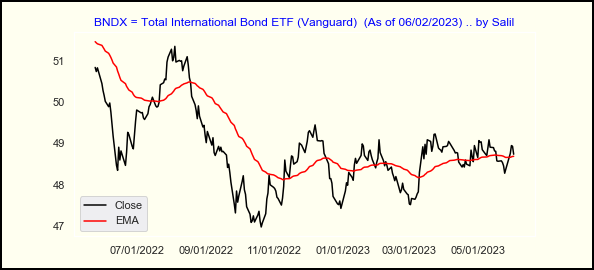
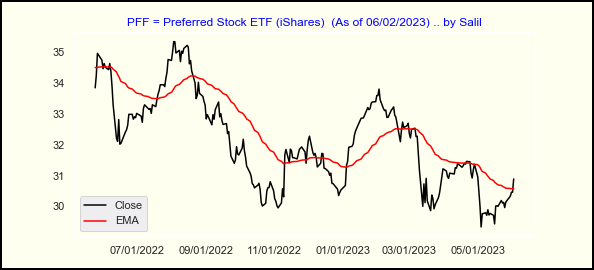
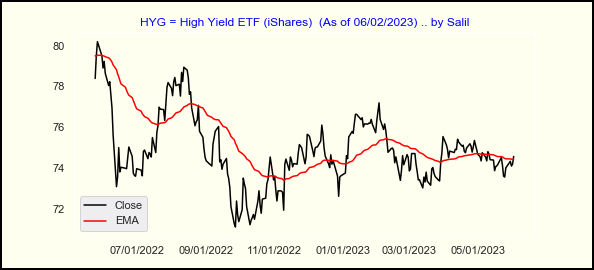
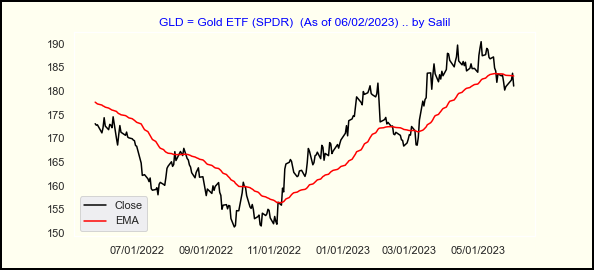
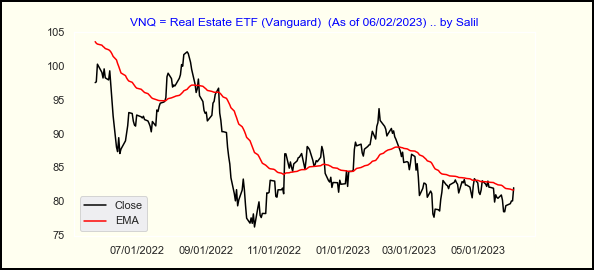
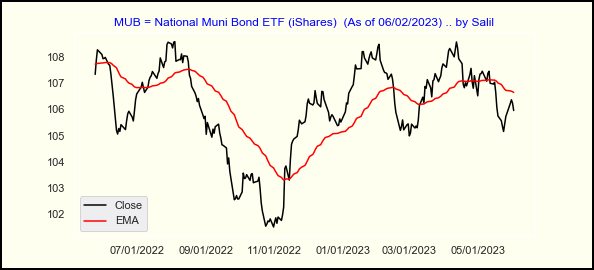
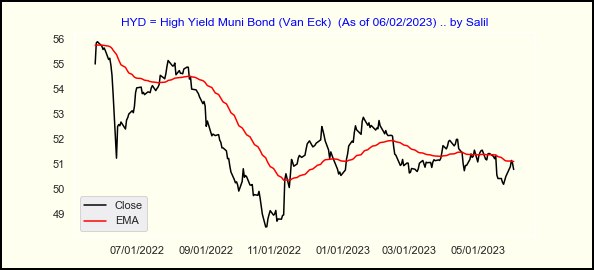
A visual summary that shows some of the major ETFs representing US Large Capitalization Stocks, Small/Mid Capitalization Stocks, US Bonds, Junk Bonds, Foreign Bonds, Preferred Stocks, REITs, Gold, Developed Markets, and Emerging Markets, is quite useful at the beginning of trading day.
As a coder, I use Python/Pandas/MatPlotLib to generate this visual summary every day using EOD Data. I'm publishing this summary below.
This is always according the EOD prices of the earlier trading-day. To see the underlying Python Code surf over to Algo : Daily Charting.
|