EOD Data:
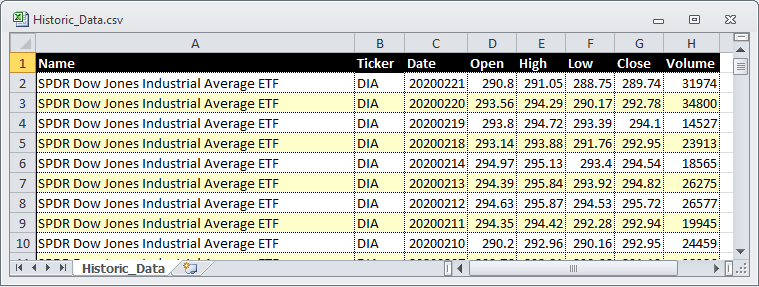
The data using which a Chartist/Technical-Analyst such as myself, makes the trading decisions is the End-Of-Day data. I use several data vendors to download the End-Of-Day data for Equities, Indexes, ETF and Mutual Funds. The data-feed can be in multiple formats - some open - some propritary - but no matter what format, ultimately it's always possible to generate a CSV format that has columns Name, Ticker, Date, Open, High, Low, Close and Volume such as given below.
Algorithm:
- Get the site password for FTP-ing to salilgangal.com
- Read the CSV file into a Pandas dataframe
- Create a Python List of the ETFs for charting
- Loop over the list one ETF at a time
- Create a Pandas dataframe for the current ETF
- Initialize a MatPlotLib figure
- Make a subplot of the dataframe for the current ETF
- Format the subplot and place it on the figure
- Save the figure as a PNG image
- FTP the images to salilgangal.com site
Python Code:
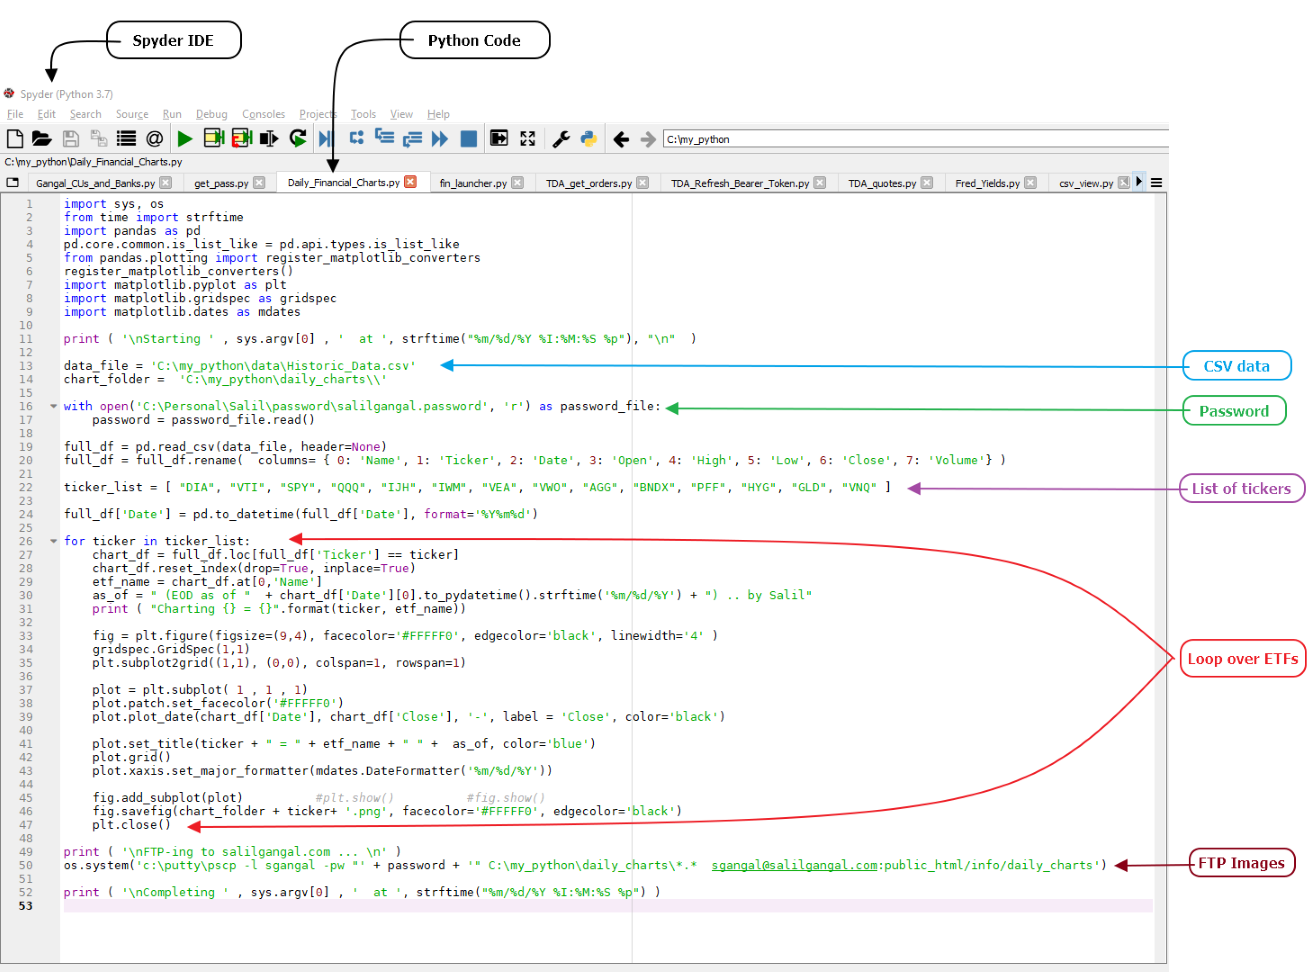
Following image shows the Python code for the Daily Charting in Spyder IDE.
Execution of Python Code:
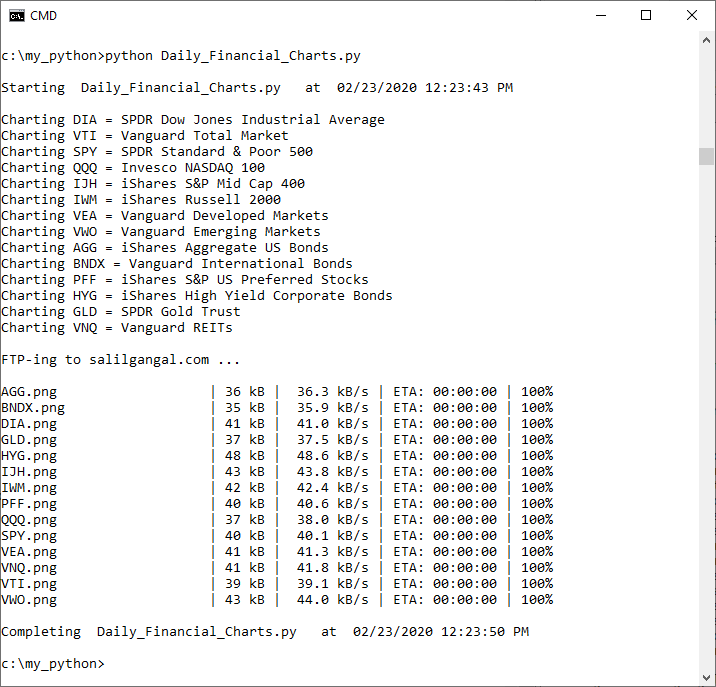
Following image of the DOS CMD window shows the execution for the python code ... took just 7 seconds to complete ...
The charts:
To see the outcome surf over to Financial_Markets : Visual Summary.
|