Income:
According to the IRS, there are two types of income: Earned Income, and Unearned Income.
Earned income typically is the income that one gets by doing a job, running a business, fighting a war. This type of income is a result of some activity. The Wages, Tips, Profits-from-a-business, Combat Pay, are earned income. (Combat Pay is tax-exempt. Ah ... yes ... and there's DOD Savings Deposit Program for our War Fighters, that has guaranteed rate of 10% per year.)
Unearned Income:
Unearned Income - often times called as 'passive income' - is the income that's typically obtained without doing a job, without running a business, without fighting a war etc.
This type of income is so passive, that one can get it even when one is sleeping, vacationing, watching movies etc. And that's the type of income I'm going to address !!
Interest, Dividend, Social Security Payment, Annuity Payment, Alimony are the typical examples of the unearned income.
At its simplest, the interest that's gained from a Savings Account at a Bank or at a Credit Union is an example of unearned income. As we know, this interest keeps coming 24 / 7 / 365. However, most likely this interest is low, and most of the times its insufficient to keep-up with inflation. Failure to keep-up inflation means that one is losing the purchasing power of the money - oh ... and this loss is not numeric, so it's not easy to gauge, but this loss is also 24 / 7 / 365.
In order to keep-up, and exceed the inflation, I find it necessary to get income using different Financial Products that give much better returns than a typical Savings Account. This 'better' rate offered is associated with 'higher' risk and higher intricacies, which is why getting the unearned income needs more - much more - attention that the Savings Account!
Taxes and Day-Job:
Getting the 'unearned/passive' income is not an easy job (pun intended). It does require activity from me. I perform the activities of tracking/trading/accounting, and of course filing tax returns.
I mostly trade using tax-deferred accounts such as IRAs, Annuities, Rollover-IRAs, 401(k)s, in order to alleviate the burden of making the tax-return, but there are quite a few trades that I execute even in my Taxable Account. For all these trades, I download 1099-DIV's, 1099-OID's and 1099-B's and account for each taxable event/entry in Schedule B, and Schedule D, when I file the tax returns.
Yes ... in my day-job in the IT Department I pretty much do this sort of activity all the time ... Doing SOX reviews user-by-user, role-by-role, application-by-application, subledger-by-subledger, doing Testing field-by-field, record-by-record, doing Coding variable-by-variable, statement-by-statement, module-by-module, doing Specifications feature-by-feature, requirement-by-requirement ... all in all ... Doing Tax-Returns dividend-by-dividend, trade-by-trade is no big deal at all *smile*. I just follow the exact specifications given by IRS, to generate an exact tax-return.
I kind-of enjoy doing the tax-returns, and double/triple checking every entry and, then very comfortably signing the tax-return under the penalty of perjury. *smile* I was audited by IRS once ... and I answered each and every question they had ... no-problem !!
Sure California State Muni Bond ETFs are both Federal and State tax-exempt, and National Munis are tax-exempt for Federal Taxes, however I am obligated to perform 'activity' of accounting for 1099-DIV/B, on Schedule B/D respectively, when I file tax returns. *smile* (Aha ... and then there is 'AMT' - alternative minimum tax - a different topic altogether.) The profits I get from buying/selling (shorting/covering) ETFs and Mutual Funds are Capital Gains. These are not considered as 'income' by the IRS. These are reported on 1099-B.
Income Generating Securities:
There are many securities using which one can generate income. Some of them are:
- Treasury Bills/Notes/Bonds - I don't use these to trade at all, but I track these carefully. (Click here and click here to see the material.) These give me intelligence such as Yield-Curve.
- REITs (Real Estate Investment Trusts)
- Corporate Bonds
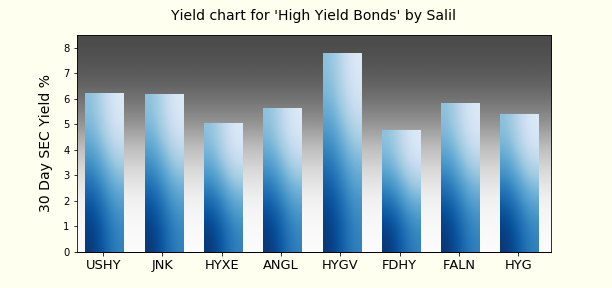
- High Yield Bonds (AKA Junk Bonds)
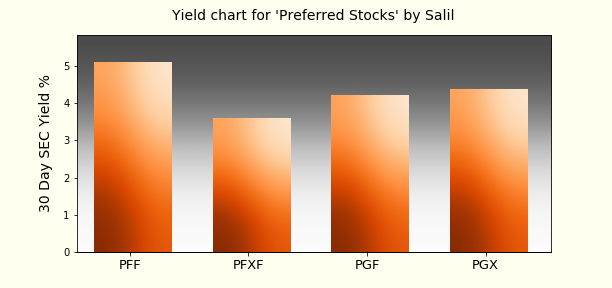
- Preferred Stocks
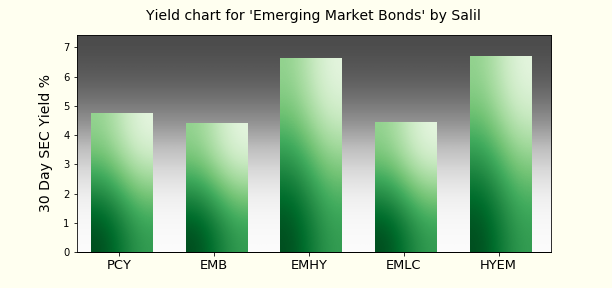
- Emerging Market Bonds
- Structured Notes - For decades I've used Structured Notes very successfully. Click here to see the material.
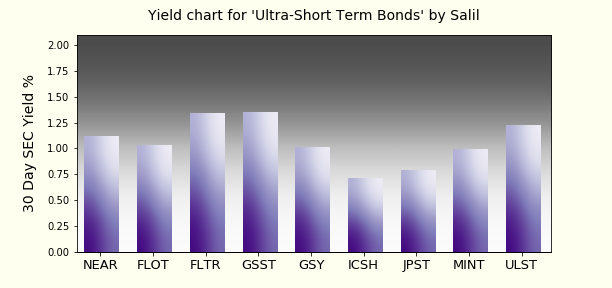
- Ultra-Short-Term Bonds - Since October 2019, I've started using Ultra-Short-Term-Bond-ETFs extensively. Click here to read the material about it.
I use the High Yield Bonds, Preferred Stocks, Emerging Markets Bonds all the time to get Income. As is my style, I typically don't trade individual bonds or preferred stocks, instead, I almost always use ETFs. For these ETFs I track the yields from time to time. This tracking is not daily, but I do this every quarter or so. The yields do not change very rapidly - therefore I don't keep an extremely close eye on the yields.
The unearned income starts on the day that I buy the income generating security, and stops when I sell the income generating security. For 'Structured Notes' there is another factor - the 'call'. Many of the Structured Notes are 'callable', so it's possible that these securities are redeemed by the issuer earlier than the maturity date. With the ETFs and Mutual Funds there is no 'call', therefore the unearned income generation is easy to follow. Every day that I own the security, the interest/dividend accumulates, and at the distribution frequency the accumulated interested is paid. For most of the High Yield, Emerging Markets, Preferred Stock the frequency is every month./p>
Dates:
With the income generating ETFs there are a few important dates. With the Mutual Funds, these are nearly similar. For Structured Notes the dates are listed in the "Term Sheet".
- Record Date: This is the date when the management of the ETF makes a determination about who are the owners of the ETF, and need to be paid the dividends.
- Declaration Date: This is the date when the management of the ETF declares the dividends.
- Ex-dividend Date: This is the date when the price (NAV) of the ETF is adjusted for the amount of dividends that are to be paid.
- Payment Date: This is the date when the dividends are paid to the owners of the ETF that are identified above in #1. In olden days this was the date when the dividend-checks were mailed to the owners. In modern timess, these dividends are paid electronically.
Yields:
There are lots of different ways of computing the Yield. Click here to see material from Investopedia.
Due to the existance of many different methods it used to be hard for anyone to compare the yields among different products easily. Therefore SEC - securities and exchange commission - has devised a standardized way to calculate one such yield. Since the method is devised by SEC, and involves computing for 30 days, the name for this yield is '30 Day SEC Yield', and it's always expressed as a percentage. Furthermore, it is mandatory for the ETFs to compute+publish the 30 day SEC Yield. This computation also deducts the expenses (expense ratio) from the calculation. In effect, this is what allows one to actually do a comparison among different ETFs for the yields. Of course there are many other points of comparison - Average Maturity, Distribution Yield, Quality of portfolio, Volatility etc.
I trade the ETFs for High Yield Bonds, Emerging Market Bonds, and Preferred all the time using my regular algos.
US Federal Reserve:
I have been using High Yield Bond ETFs for years. Recently there's a new buyer in the market. This buyer is none other than the US Federal Reserve. At present (May 2020) the US Federal Reserve is headed by Dr. Jerome Powell.
The US Federal Reserve buys US Treasuries all the time - there is nothing new there.
Since the financial meltdown because of the Housing Bubble, FOMC started buying the Mortgage Backed Securities. The acronym for this program was TARP - troubled assets relief program. This was done back in 2008 with Emergency Economic Stablization Act.
Because of COVID-19 the Federal Reserve has entered the High Yield Bond market (commonly called as the Junk Bond market) as well !! Click here to read the full statement from the New York FED.
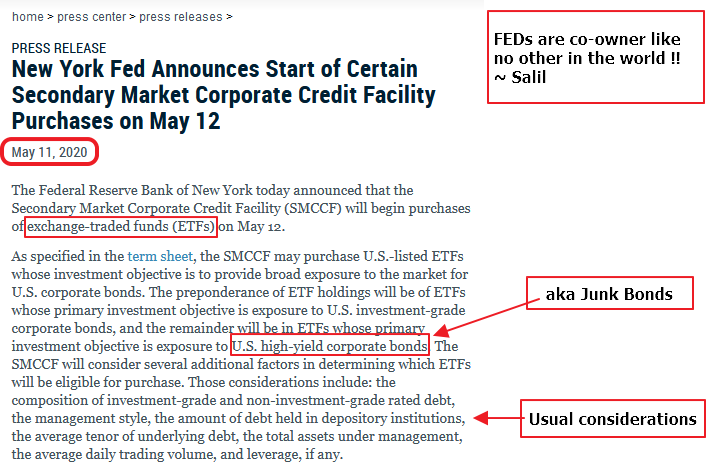
US Federal Reserve of course can create unlimited amount of money, therefore when the FEDs start supporting something anyone who is also buying the same product is standing with the FEDs - a co-owner like no other in the world !! *smile*
Presently FEDs have pored in $37.5 Billion, and they have the determination+authority to bring-in more money, if needed !! Just for comparison the 'VanEck Vectors Fallen Angel High Yield Bond ETF' has total assets under management 2.6 Billion, and 'iShares Fallen Angels USD Bond ETF' has total assets under management at 2.3 Billion. So the US Federal Reserve has poured in assets that are more than 6 times the combined assets of these two ETFs.
After IPO the former startup companies struggle year-after-year-after-year to reach valuation of 1 Billion, but for FEDs it takes just a few hours to come-up with sum of money that's 37 times bigger !!!
It is possible that because of the support from the FEDs there will be lots and lots of companies that will stay aflot rather than go under. This effect is termed as having Zombie Companies. My tactic of trading neither is based on any news, nor is based on any fundamental analysis, rather it's strictly based on Technical Analysis, therefore whatever moves FED is making in the market do not affect my trading decisions directly. If these moves generate a signal in my algorithm then - and only then - I'll take an action. I've designed my algos years ago, and I've not designed these to take into account news/tweets etc. However, as a keen follower of FED I find this move amazing.
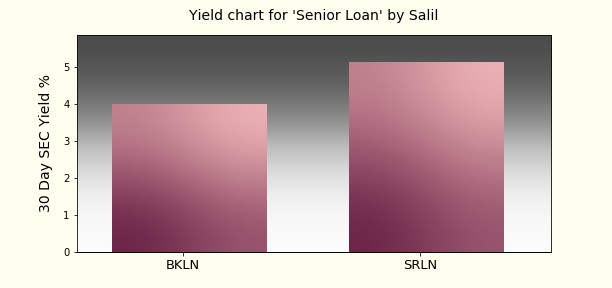
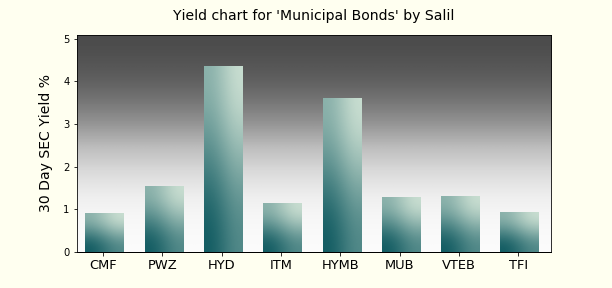
Yield visualization:
I gather the yield data from various sources, and plot bar charts to make a comparison among different groups of the ETFs. Here are charts for the Yields for the ETFs that I track for generating income.
Performance visualization:
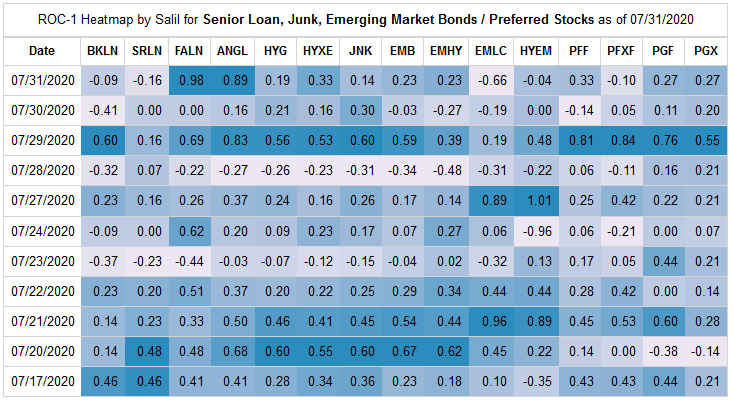
I don't track the Yields daily, however I do track the performance of these ETFs every day using a Python Program I've developed.
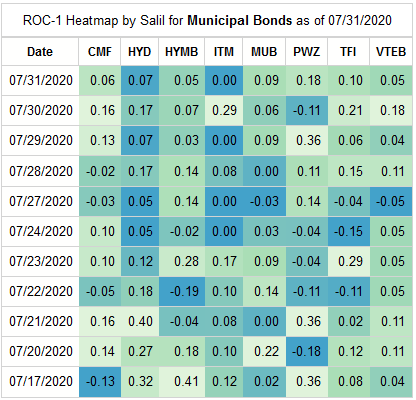
The daily up/down percentage is tracked in the following Heatmap. In technical analysis this is termed as 'ROC-1', which stands for rate of change for 1 day. I trade Municipal ETFs only in taxable account, therefore I track Munis separately. Here are the Heatmaps:
Performance visualization - Line Charts:
I track the daily performance using Line Charts as well.
I publish some of these daily. Click here to surf over to charting page and see the charts for MUB, HYD (last row) and PFF, HYG (third last row).
Python Coding:
I'm a trader/coder. Earlier details are focused on trading/tracking, so here are a few details that are related to Coding !
I've used Python/Pandas/MatPlotLib/Palettable/BeautifulSoup to do data-gathering and visualization for these charts.
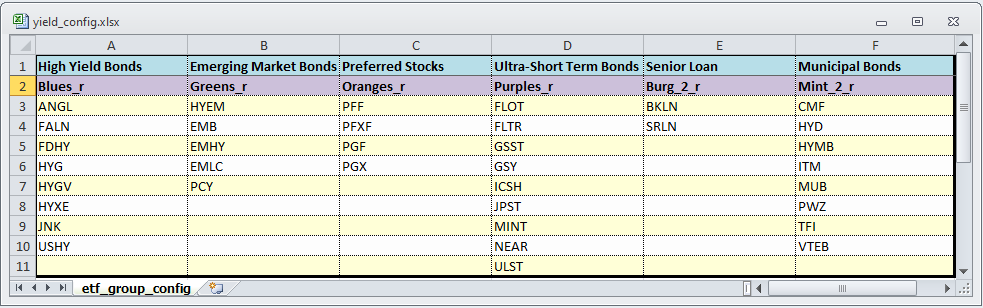
I've placed the config in the Excel workbook given below which is read by the Python program I've developed. Program renders the Charts based on these configs.
The worksheet 'etf_group_config' has the details for Groups of ETFs and the related configurations.
The first row has the title of the visualization that gets in between the verbiage 'Yield chart for' and 'by Salil'.
The second row has the colormap applied when rendering the chart. This is described in more detail in the section below.
The third row onwards are the different ETFs that make-up the particular group.
This config has advatge that it gives me flexibility. I can insert/update/delete Groups by using the columns, and I can insert/update/delete ETFs within a group by using the rows, without changing the code at all.
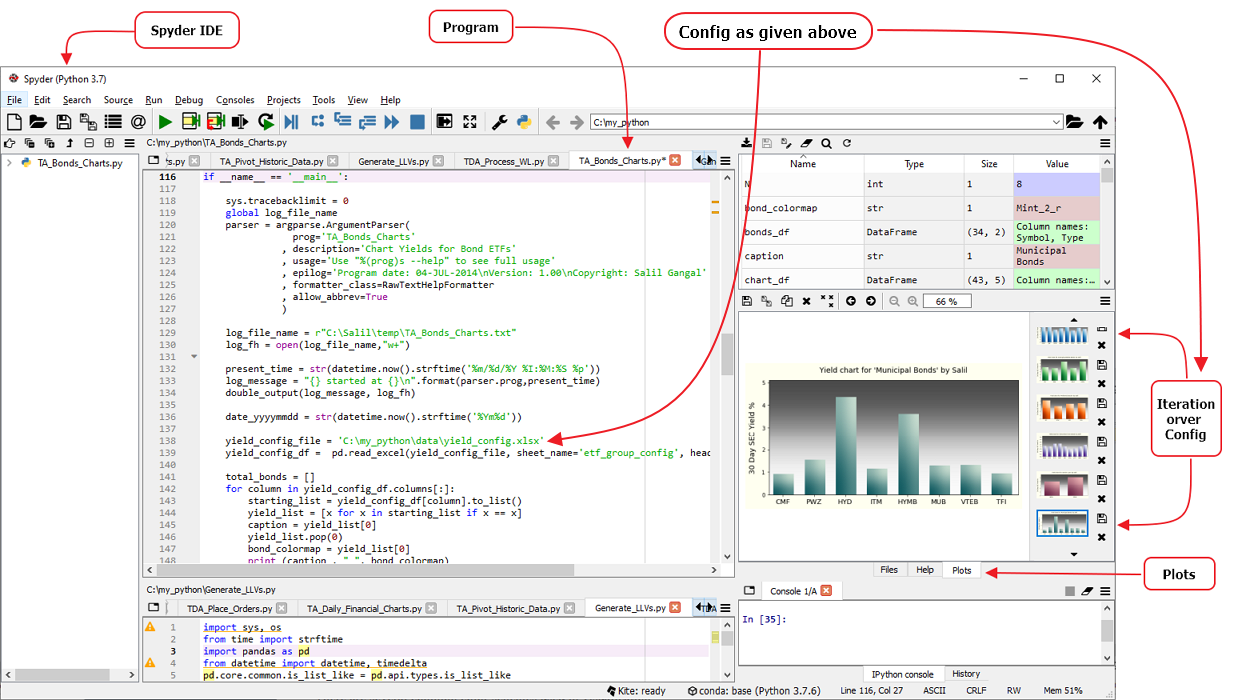
I'm giving below the screen-grab of the Spyder IDE that shows execution of this program. The "Plots" in the IDE is showing outputs of plt.show() commands as the program iterates over the High Yield Bonds, Emerging Market Bonds, Preferred Stocks etc. from the "Config" given above.
Python Palettable Colormaps:
There are a large number of color maps available in the Python library Palettable for coloring the charts. These may be used instead of / in addition to, the MatPlotLib colormaps. I've used some of the Colormaps from Palettable in addition to standard MatPlotLib.
See colormaps from Palettable at the following links:
- Catrocolor
- CMOcean
- ColorBrewer
- LightBartlein
- MatPlotLib
- MyCarta
- Scientific
- WesAnderson
- Tableau
This is almost like browsing the sites of Kelly-Moore or Sherwin-Williams. *smile*
|